. 2019 Feb 12;9(10):5338–5346. doi: 10.1039/c8ra06652c

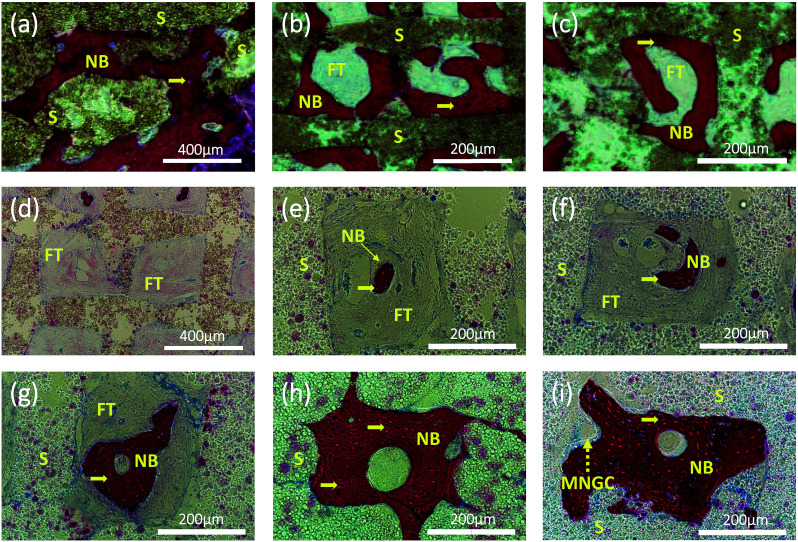
Fig. 7. Representative histological section images stained by H&E showing two patterns of new bone formation: one pattern represents the new bone growing close to the wall of the grid (a–c); another pattern represents the new bone, emerging early in the center of the grid and then growing and filling the entire grid with a channel in the center (d–i), similar to the natural osteon formation. Pictures (a–c) are of the samples of PCL/HA scaffolds after 12 weeks implantation. Pictures were taken of the samples of PCL/PVAc/HA scaffolds after implantation for 4 (d and e), 8 (f and g) and 12 (h and i) weeks, respectively. Yellow arrows: osteocytes; yellow dashed arrow: multinucleated giant cell; NB: new bone; S: scaffolds; FT: fibrous tissue; MNGC: multinucleated giant cell.

Fig. 7