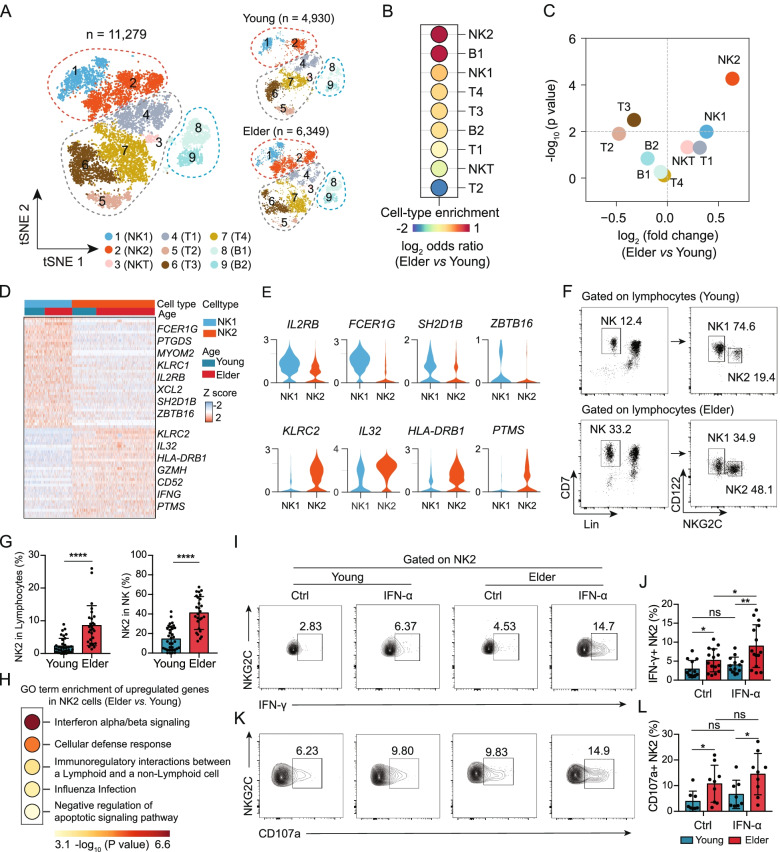
Fig. 1.
Ageing leads to a marked increase in the proportion of memory-like NK2 cells among total blood lymphocytes. A t-SNE representations of the integrated single-cell transcriptomes of 11,279 PBMCs, with 4930 cells from the 4 young individuals (ages 21–28 years) and 6349 cells from the 4 elderly individuals (ages 65–68 years). Cells are coloured by cell type identity. Each dot represents a single cell. B Dot plot showing the log2 (odds ratio) of the comparison between the cell proportions of each cell cluster in the young and elderly samples. C Scatterplot showing the logarithmic ratio between the estimated frequencies of each of the 9 cell clusters in young individuals (n = 10) and those in elderly individuals (n = 10) from bulk RNA-seq datasets (GEO103232). D Heatmap showing the top 30 differentially expressed genes for NK1 and NK2 cells from young and elderly individuals. E Violin plot showing the gene expression in NK1 and NK2 cells. F FACS staining strategy for NK1 (Lin-CD7+ NKG2C−CD122high) and NK2 cells (Lin−CD7+ NKG2C+CD122low) from young (top) and elderly (bottom) individuals. G Bar graphs showing the proportions of NK2 cells in lymphocytes (left) and NK2 cells in NK cells (right) from young (n = 35) and elderly (n = 27) individuals. H Gene Ontology (GO) enrichment analysis of the differentially expressed genes of NK2 cells from young individuals and those from elderly individuals. The colour indicates the -log10 (P-value) enrichment for each GO term. I Flow cytometry analysis of IFN-γ in NK2 cells from young and elderly individuals with or without IFN-α stimulation in vitro. J Bar graphs displaying the frequencies of IFN-γ+ in the NK2 subpopulation from young (n = 13) and elderly (n = 15) individuals with or without IFN-α stimulation in vitro. K Flow cytometry analysis of CD107a in NK2 cells from young and elderly individuals with or without IFN-α stimulation in vitro. L Bar graphs displaying the frequencies of CD107a+ in the NK2 subpopulation from young (n = 8) and elderly (n = 9) individuals with or without IFN-α stimulation in vitro. The error bars represent the standard deviation (SD). *P < 0.05, **P < 0.01, ****P < 0.0001. P-values were obtained with two-sided Student’s t-tests. The results are representative of at least three independent experiment

