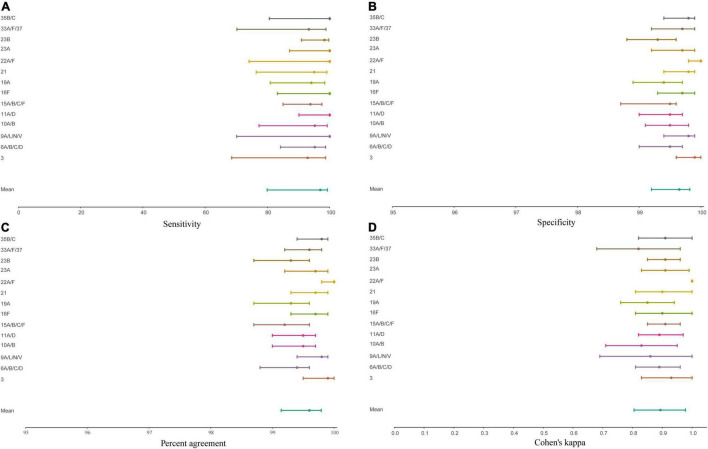
FIGURE 5.
Forest plot displaying the point estimate and 95% confidence of intervals sensitivity (A), specificity (B), concordance (C), and Cohen’s kappa (D) for molecular diagnostic tests applied to culture-enriched samples when compared to isolation of S. pneumoniae strains of particular serotype/serogroup from nasopharyngeal swabs collected in the study. Graphs displayed results for serotypes/serogroups that have been cultured from > 5 nasopharyngeal samples.

