Abstract
In this study, the influence mechanisms of graphene oxide (GO) on the membrane substrate/active layer for improving the water flux and anti-biofouling ability of thin-film composite (TFC) membranes in forward osmosis (FO) were systematically investigated. We fabricated a pristine TFC membrane, a TFC membrane in which the substrate or polyamide active layer was modified by GO (TFN-S membrane or TFN-A membrane), and a TFC membrane in which both the substrate and active layer were functionalized by GO (TFN-S + A membrane). Our results showed that the TFN-S membrane possesses a higher water flux (∼27.2%) than the TFN-A because the substrate that contained GO could improve the porous structure and porosity, while the TFN-A membrane exhibited a lower reverse salt flux and higher salt rejection than the TFN-S membrane, indicating that the surface properties played a more important role than the substrate for the salt rejection. Regarding the biofouling experiment, the TFN-A and TFN-S + A membranes facilitated a higher antifouling performance than the TFN-S and TFC membranes after 72 h of operation because of the greater hydrophilicity, lower roughness and facilitated higher bactericidal activity on the GO-modified surface. In addition, the biovolume and biofilm thickness of the TFN-A and TFN-S + A membranes were found to follow the same trend as flux decline performance. In conclusion, the substrate modified by GO could greatly improve the water flux, whereas the GO-functionalized active layer is favorable for salt rejection and biofouling mitigation. The advantage of TFN-A in biofouling mitigation suggests that the antibacterial effect of GO has a stronger influence on biofouling control than the changes of hydrophilicity and roughness.
The substrate modified by GO could greatly improve water flux, whereas the GO-functionalized active layer is favorable for biofouling mitigation.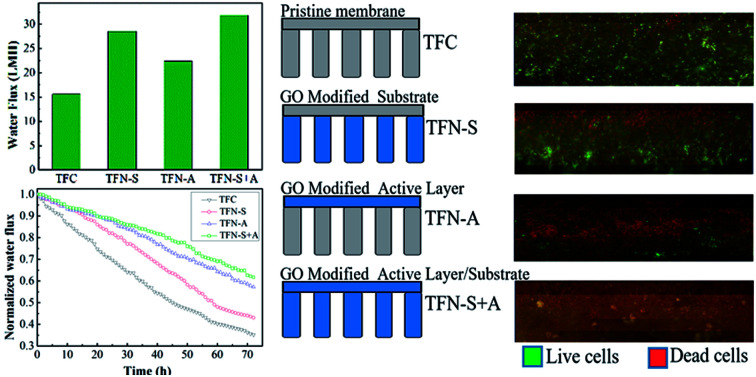
1. Introduction
Forward osmosis (FO) is a membrane process that utilizes the different osmotic pressures between the feed solution and the draw solution as a driving force.1,2 In recent years, FO has gained remarkable attention for many applications such as desalination, wastewater treatment, pharmaceutical wastewater treatment and food processing3–6 due to its low energy consumption, high solute rejection, low concentration polarization and fouling propensity, and high water recovery.7,8
Thin film composite (TFC) polyamide FO membranes are preferred in FO technology due to their higher water flux, better solute rejection and fouling resistance compared to traditional FO membranes.9,10 A major challenge associated with membrane technology is the inherent trade-off between membrane permeability and selectivity. Meanwhile, membrane fouling inevitably limits its application, causing membrane performance deterioration and increasing operating costs.11 Membrane fouling includes colloid fouling, inorganic fouling, organic fouling and biofouling.12 Among them, biofouling is the most difficult to control due to strong bacterial adhesion onto the surface and sticky extracellular polymeric substances (EPS).13 In general, biofouling is considered to occur from a combination of four sequential steps: (1) introduction of nutrients and bacteria in the feed solution to the membrane surface by hydrodynamic and diffusive transport, (2) the formation of a so-called conditioning layer through adsorption of nutrients and organic matter, (3) reversible or irreversible adhesion of microorganisms onto conditioned surfaces and (4) multiplication and metabolism of initial attachments, resulting in the biofilm.14 For the FO membrane properties, the surficial membrane properties can affect the adhesion of microorganisms and organic matter, whereas the membrane substrate can influence the internal concentration polarization (ICP), which could accelerate the formation of biofilm.15–19
With rapid progress in nanotechnology, intensive investigations have found that the incorporation of the functional nanomaterials into membranes can improve the membrane selectivity, permeability and fouling resistance. Nano-sized materials such as titanium dioxide (TiO2), carbon nanotube (CNT), graphene oxide (GO), and silicon dioxide (SiO2) are typically utilized in thin film nanocomposite (TFN) membrane fabrication because of their excellent transport characteristics, smooth structures and easily tunable surface chemistries, which can increase the mechanical capacity, hydrophilicity and antifouling properties of membranes.20–22 As a novel nanostructured material, graphene oxide (GO) possesses hydrophilic functional groups, including epoxide and hydroxyl groups on the surface and carboxylates at the periphery, which improve the hydrophilicity of a modified membrane.23,24 In addition, a GO nanosheet is typically one atom thick for its nanoscale thickness (thickness = 1–2 nm) and two-dimensional (2D) single-layer,25,26 generating a high specific surface area. To date, numerous efforts have been made to modify TFC membranes using GO for the active or support layers to make them efficient in the membrane process. Many studies have shown that the incorporation of GO into the active layer of the TFC membrane could result in higher surface hydrophilicity, lower roughness.27,28 In addition, Menachem et al. found that GO results in bactericidal activity through disrupting the cell membrane when bacterial cells are in contact with GO-modified surface.29,30 For the substrate, incorporation of GO into the substrate of a TFC membrane could enhance membrane hydrophilicity and porosity, which remarkably improved the water flux and lowered the effect of ICP phenomenon.31,32 In addition, GO-functionalized substrate could affects the mechanical strength and the performance of the active layer of TFC membranes.33–35 Furthermore, Chae et al. reported the synergetic effect of GO embedded in both the polyamide (PA) active layer and PSf substrate. The results showed that the water flux and anti-biofouling property of the reverse osmosis membrane with GO embedded in both layers increased obviously, as compared to the membranes with the GO only intercalated in the support layer or active layer.36 Although several researchers have suggested that incorporation of GO into active layer or substrate of TFC membrane could improve the membrane performance in the FO process, but limited attention has been given to the comparison of GO influence mechanisms on substrate or active layer, and answer which incorporation method is more effective for improvement of water permeability or biofouling mitigation. A clear answer could provide a theoretical basis for future practical applications. Hence, we fabricated four different membranes via GO modification of substrate or/and active layer to clarify the effects of GO nanoparticles on improvement of membrane performance and biofouling resistance.
In this study, we focus on how the presence of GO nanomaterials with different loadings could alter the characteristics of active layers and supporting substrates of the TFN membrane and how they improve the membrane anti-biofouling performance during the same FO process. We introduce GO into the TFC membrane using blending techniques and interfacial polymerization to prepare four kinds of membranes. A characterization of changes in surface properties and porous structure imparted by GO, in conjunction with an analysis of penetrability and anti-biofouling ability in terms of extracellular polymeric substance (EPS), biofilm thickness and total cell counts, provide insights into the mechanisms associated with GO.
2. Materials and methods
2.1. Materials
Polysulfone (PSf) granules were provided by Sigma-Aldrich. Graphene oxide (GO) was purchased from Suzhou Tanfeng Company. N,N-dimethyl formamide (DMF), Twain-80, sodium citrate, ammonium chloride (NH4Cl, 99%), sodium hydroxide (NaOH), potassium chloride (KCl), sodium hydrogen phosphate (Na2HPO4), potassium phosphate monobasic (KH2PO4, 99%), phenol, sodium bicarbonate (NaHCO3, 99%), magnesium sulfate heptahydrate (MgSO4·7H2O, 98%), sodium chloride (NaCl, crystals), and normal hexane were purchased from Siong Chemical Co., Ltd. Polyethylene glycol-600 (PEG-600), glucose (C6H12O6), and calcium chloride hydrate (CaCl2·H2O, 99%) were obtained from Sinopharm Chemical Reagent Co., Ltd. Sulfuric acid (H2SO4) was purchased from Beijing Chemicals Co., Ltd. Tryptone and yeast extract were provided by Angel Yeast Co., Ltd. M-Phenylenediamine (MPD) and trimesoyl chloride (TMC) were acquired from the Aladdin Industrial Corporation. Distilled (DI) water with a resistivity of 3.7 μs cm−1 was produced using an ultrapure water system.
2.2. The fabrication of thin-film composite membrane
In this paper, we prepared four kinds of TFC membranes and compared them to each other. The four membranes included two kinds of substrates (GO–polysulfone (GO–PSf) substrate and pristine–PSf substrate) and two kinds of active layers (GO–polyamide (GO–PA) active layer and traditional polyamide (PA) active layer).
2.2.1. Preparation of substrates
The substrates were prepared using a phase inversion method. For the GO–PSf substrate, the GO/PSf/polyethylene glycol-600 (PEG-600)/Tween-80 with varied concentrations were dissolved in a N,N-dimethyl formamide (DMF) solution at 70 °C and stirred for 10 h. After 6 h of degassing, the mixed solution was cast on a glass plate using a casting knife with a 50 μm thickness, and then that glass plate was immediately dipped into deionized water (DI) water at room temperature. The solidified substrate was separated from the glass plate and a flat sheet membrane was obtained. To remove the residual solvent, the DI water was changed every three hours for 24 h. Then, the clean membrane was stored in DI water until use. For the PSf substrate, the only difference from the GO–PSf substrate was that the solution excluded GO during membrane preparation.
2.2.2. Thin-film composite active layer fabrication
A polyamide (PA) active layer was synthesized on the substrate using interfacial polymerization to prepare the TFC membrane. For the membrane with a GO–PA active layer, the substrate was soaked in a mixed solution of 3 wt% M-phenylenediamine (MPD) and GO for 5 min, and then the excess MPD solution was removed using wipes. Then, a trimesoyl chloride (TMC) solution (0.15 wt%) in n-hexane was poured onto the substrate surface for 3 min. The substrate was placed in an oven at 60 °C for 5 min for heat treatment. The resulting GO–TFC membrane was stored in DI water until use. For preparing the traditional PA active layer of the TFC membrane, an aqueous solution without GO was used.
Four types of membranes were obtained from the combinations of the two substrates and two active layers. The PSf substrate that was made with a PA active layer using interfacial polymerization is denoted as “TFC membrane”. The GO–PSf substrate that was made with PA active layer using interfacial polymerization is denoted as “TFN-S membrane”. The PSf substrate that was made with a GO–PA active layer using interfacial polymerization is denoted as “TFN-A membrane”. The GO–PSf substrate that was made with a GO–PA active layer using interfacial polymerization is denoted as “TFN-S + A membrane”. A sketch is shown in Fig. S2.†
2.3. Membrane characterization
The hydrophilicity of the membrane surface was evaluated using a contact angle goniometer (JC2000D2, Shanghai Zhongchen Digital Technology Apparatus Co., Ltd) and the sessile drop method in which the drop volume was 5 μL and each membrane was calculated as an average of at least three points. An atomic force microscope (AFM) (NanoSCope IIIa, Digital Instruments) was used to investigate the surface roughness of the active layer of the TFC membranes under tapping mode in the air. A morphological analysis of GO was also characterized, as shown in the ESI.†
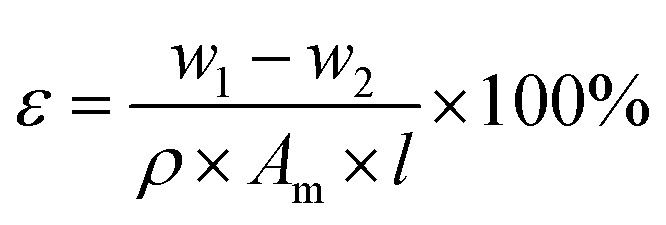
The pore size and porosity of the substrate reflects the permeability of the membrane. Pore size of the substrates were examined by filter aperture analyzer (Beishide, 3H-2000 PB, China). The surface tension was 17 dyn cm−1 and the membrane samples were cut to the same size (the diameter was 2 cm). The substrate porosity reflects the permeability of the membrane. To measure the porosity of the substrate, membrane samples were prepared in the size of 2 cm × 2 cm and were immersed in ethanol for 3 h. Then, the ethanol-soaked substrate was removed and weighed on an electronic balance (w1, g) after the removal of excess ethanol with tissue paper. The membrane was dried in the oven at 50 °C for 10 h and re-weighed as w2, (g). The thickness of membrane was measured using the thickness gauge. The substrate porosity value was calculated according to eqn (1):
 |
1 |
where ε is the substrate porosity of the membrane, w1 − w2 is the ethanol content, Am (m2) is the effective membrane area of the sample, ρ is the ethanol density (g cm−3), and l is the thickness of membrane (μm).37
2.4. Evaluation of membrane performance
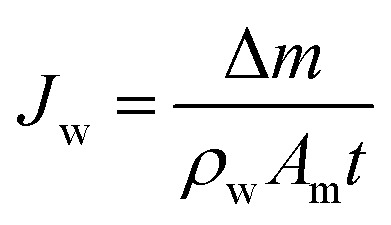
The FO test was carried out using a lab-scale cross-flow filtration system. The effective filtration area of membrane cell was 32 cm2. The draw solution and feed solution were NaCl solution (2.0 M) and DI water, respectively, with identical flow rates of 8 cm s−1 to analyze the water flux and reverse salt flux. The water flux and reverse salt flux of the prepared membranes were evaluated in FO mode (active layer faces to the feed solution). All experiments were conducted at a room temperature of 25 ± 2 °C and in triplicate runs. The water flux (Jw, L m−2 h−1 (LMH)) through the membrane was obtained by measuring the weight change of the feed solution (Δm) which passed through the effective surface area (Am, m2) of the membrane:
 |
2 |
where ρw is the density of the water and t is the interval of time (the specific time period of the experiment). The reverse salt flux (Js, g m−2 h−1 (gMH)) from the draw to the feed solution was determined by:
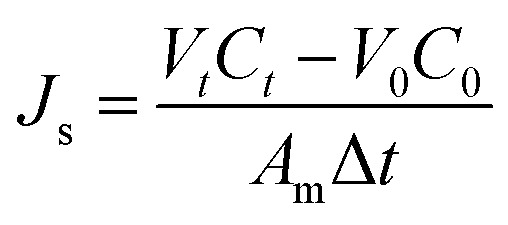 |
3 |
where Ct is the salt concentration, Vt is the feed volume at time t, V0 and C0 are the feed volume and the salt concentration at the starting time, respectively.
To calculate membrane salt rejection, the membranes were studied with an RO system by filtering NaCl (10 mM) aqueous solutions under an operating pressure of 0.5 MPa. The resulting permeate that was collected as the output was tested using a conductivity meter. The rejection percentage was calculated using:38
 |
4 |
where Cf is the concentration of the feed solution, and Cp is the concentration of the permeate solution.
2.5. Antimicrobial activity of membranes
To accurately determine the biofouling mitigation potential of TFC and the modified membranes, dynamic biofouling assays were conducted in a foresaid FO unit, and the temperature was maintained at 25 °C throughout the filtration process. Before the formal experiment, the operation system was disinfected with a recirculation of 75% ethanol for 2 h and was then recirculated 3 times using DI water. Synthetic wastewater was used as the feed water with a composition as follows: 1.2 mM sodium citrate, 0.8 mM NH4Cl, 0.5 mM NaHCO3, 0.2 mM K2HPO4, 8.0 mM NaCl, 0.2 mM CaCl2·H2O and 0.15 mM MgSO4·7H2O,27 where the conductivity is 1378 us/cm and pH is 7.2. Pseudomonas aeruginosa (P. aeruginosa) was cultivated to simulate biofouling, and the initial bacterial concentration of the synthetic wastewater was prepared to be 5 × 10⁷ cells per mL. The NaCl solution was used as the draw water, the concentration adjusted to achieve an initial water flux of ∼12 LMH for all membranes. A digital balance connected to a computer was used to automatically record the changes in water flux. For each membrane, biofouling experiments and blank experiments (without foulant) were executed for 72 h continuously. The blank measurements were carried out to quantify the water flux reduction due to the adsorption of compounds in the feed solution and the decrease in osmotic pressure caused by draw solution dilution and feed solution concentration.
2.6. Characterization of membrane foulants
To understand the role of GO in biofouling mitigation, the membrane was removed from the cell after 72 h of filtration and was stained for CLSM analysis. Membrane coupons (1 cm2) were cut from the biofouled membrane, were stained with SYTO 9 and propidium iodide (PI) and were subsequently incubated in the dark for 30 min. The staining solution was removed and the membranes were rinsed twice with PBS before being mounted on a microscopic slide for confocal laser scanning microscopy (CLSM, 710, ZEISS, Germany). Biofilm thickness was quantified at an interval of 0.45 mm by acquiring z-stacks in which three different fields of view were obtained at random orientations for each image, as demonstrated in our previous work.14 Live (green) cells and dead (red) cells were counted with the ImageJ cell counter plugin.39
Adenosine triphosphate (ATP), EPS and total organic carbon (TOC) analyses of the fouled membrane surfaces were performed after the biofouling operation. Before analyzing for the above contents, a 2 cm × 8 cm membrane segment was immersed in 10 mL of NaOH (1 M) and sonicated for 30 min to remove the attached biofilm and was then placed in a refrigerator at 4 °C for 24 h. ATP was determined using the Bac Titer-glo™ Substrate/Buffer (Promega, USA). EPS on the surfaces of the membranes was measured using the plate count method and phenol/sulfuric methods. The TOC content was measured using a TOC analyzer (TOC-L CPN, Shimadzu, Japan). More details are available in our previous studies.14
3. Results and discussion
The incorporating concentrations of GO into the substrate and active layer were systematically optimized, and 0.15 wt% and 100 ppm were chosen as the optimal dosage for the substrate and active layer modification, respectively. The nature and characteristics of commercial GO are shown in the ESI (Fig. S1†).
3.1. Characterization of GO functionalized membranes
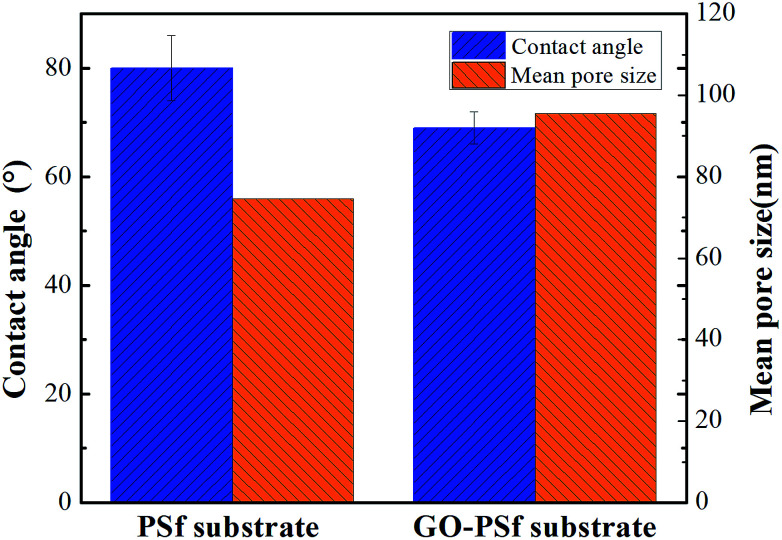
The contact angles of the substrates and both the composite membranes are systematically compared (Fig. 1 and Table 1). The contact angle of the PSf substrate was 80 ± 6°, whereas that of the GO–PSf substrate decreased to 69 ± 3°, indicating that the hydrophilicity of the GO-functionalized substrate was higher due to the abundant hydroxyl and epoxide functional groups of the GO. Additionally, a more hydrophilic active layer of the TFC membrane was obtained after synthesis of a polyamide layer on the substrate. The GO-functionalized TFN membranes exhibited lower values than the traditional TFC membrane. In more detail, the TFN-S membrane exhibited a lower contact angle than pristine TFC membrane, although they had the same PA active layer. This may be because the porous substrate surface could affects the formation of microstructure of PA layer, and the microstructure of PA layer will further affects the contact angle.40 Compared to the TFN-S membrane (56°), the TFN-A membrane shows a lower value (41°), illustrating that the incorporation of GO into the active layer increased the hydrophilicity more significantly than adding GO into substrate. The results of the mean pore size and porosity of the pristine and GO-functionalized membranes are shown in Fig. 1 and Table 1. For the mean pore size, GO–PSf substrate exhibits a larger pore value (95.5 nm) than the pristine–PSf substrate (74.6 nm). In general, hydrophilic GO could increase the thermodynamic instability between the polymer and the solvent, which resulted in membranes with larger pore sizes.36,41 Regarding the porosity of the membranes, the TFC and TFN-A membranes that had pristine substrates exhibited similar porosities of nearly 36%, whereas the TFN-S and TFN-S + A membranes with the GO-blended substrates had higher porosities of nearly 55%. The higher porosity occurs because the casting solution with the added hydrophilicity of GO could be desolvated faster in water during phase inversion.32 The roughness profile of the surface layers (Table 1) showed that the surface roughness of the four membranes decreased in the order TFC > TFN-S > TFN-A > TFN-S + A with root-mean-square (RMS) values of 112 nm, 93.8 nm, 77.3 nm and 70.6 nm, respectively. More details, TFN-S membrane with a larger surface pore size and higher porosity has a lower roughness than TFC membrane. This is because the more hydrophobic PSf substrate makes it easier to form a convex meniscus of the MPD solution in the pores than the GO–PSf substrate, resulting in a larger surface roughness. In addition, the smaller pore sizes of the PSf substrate could further increase the roughness of the surface.42 For the TFN-S and TFN-A membranes, the results suggested that the incorporation of GO into the PA layers, instead of the substrate, caused a more dramatic reduction in surface roughness. Therefore, we conclude that GO modification of an active layer made a great contribution to the membrane surface properties in terms of roughness and hydrophilicity, whereas modification of substrates had a more important influence on the membrane porosity. Among these membranes, the TFN-S + A membrane with both the substrate and active layer functionalized by GO possessed highest hydrophilicity and porosity.
Fig. 1. The contact angle and mean pore size of PSf and GO–PSf substrates.
Membrane properties of pristine TFC and TFN membranes.
| Parameters | Contact angle of TFC membranes (°) | Porosity (%) | RMSa (nm) | R a b (nm) | R max/10c (nm) |
|---|---|---|---|---|---|
| TFC | 65 ± 8 | 36 ± 7 | 112 ± 13 | 91.4 ± 3 | 79.5 ± 7 |
| TFN-S | 56 ± 5 | 55 ± 13 | 93.8 ± 5 | 72.9 ± 9 | 74.3 ± 16 |
| TFN-A | 41 ± 6 | 34 ± 9 | 77.3 ± 11 | 61.7 ± 6 | 57.2 ± 11 |
| TFN-S + A | 36 ± 4 | 53 ± 6 | 70.6 ± 8 | 54.6 ± 4 | 52.8 ± 7 |
RMS is the root mean square of roughness.
R a is the representative average roughness.
R max is the representative maximum roughness.
3.2. Impact of GO on the membrane performance
The performance of the TFC, TFN-S, TFN-A, and TFN-S + A membranes in terms of water flux and salt rejection are shown in Table 2. We observed that the GO-functionalized membranes showed significantly improved water flux and salt rejection obtained from the FO and RO operating system, respectively. The improved water flux and salt rejection of the prepared membrane is probably due to the embedded GO exerted effects on the membrane structure, hydrophilicity and roughness. Moreover, the water flux of the TFN-S membrane was ∼27.2% higher than that of the TFN-A membrane, due to the higher porosity of the PSf–GO substrate. Also the higher roughness of the TFN-S membrane, compared with TFN-A membrane (Table 1), caused an increase in the filtration area for water transport.43 This result indicates that the improvement in pore structure of TFC membrane is more important than the effect of improved surface hydrophilicity on water flux. Generally, the loss of draw solution is an undesirable phenomenon that accelerates the flux decline rate, causing concentration polarization and promoting membrane fouling during practical applications.31 The TFN-A membrane exhibited a lower reverse salt flux (33.3%) and higher salt rejection than the TFN-S membrane, indicating that the GO-functionalized active layer provides higher solution selectivity for the TFN-A membrane and the surface properties played a more important role than the substrate for the salt rejection.
Performance of the different membranes.
| Membrane types | TFC | TFN-S | TFN-A | TFN-S + A |
|---|---|---|---|---|
| Water flux, (LMH) | 15.6 | 28.5 | 22.4 | 31.8 |
| Reverse salt flux, (gMH) | 15 | 12 | 9 | 9 |
| Salt rejection, (%) | 83.2 | 90.5 | 93.6 | 94.1 |
3.3. The anti-biofouling properties of GO functionalized membranes in forward osmosis
3.3.1. Permeate flux reduction associated with biofouling
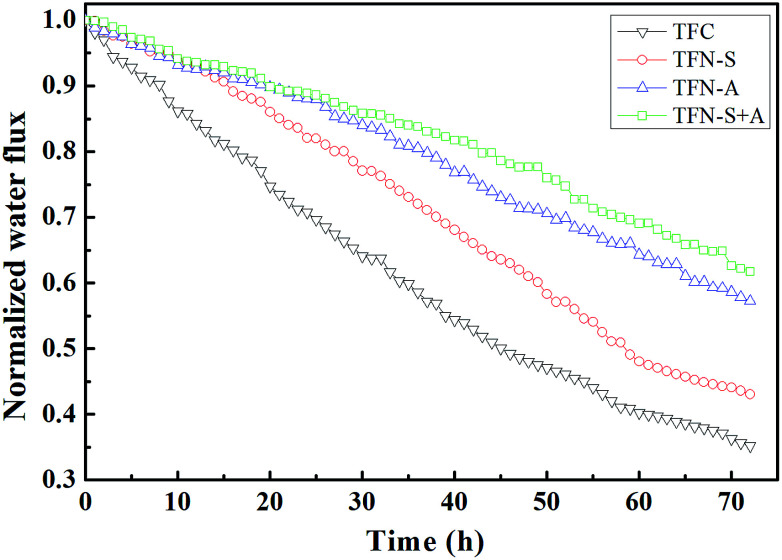
The blank experiments of the four types membranes were measured in the filtration of 72 h as Fig. S2.† The baseline for the TFC and TFN membranes following the declining order TFC > TFN-S > TFN-A > TFN-S + A. For the biofouling resistance experiments, the normalized flux of the TFC, TFN-S, TFN-A, and TFN-S + A membranes decreased to 0.38, 0.42, 0.57, and 0.65, respectively (Fig. 2). Obviously, lower flux declines were observed for the TFN-A and TFN-S + A membranes, indicating that GO modification of the membrane surface has a significant effect on biofouling mitigation. This is due to the stronger hydrophilicity, smoothness and morphologic properties of GO-modified membrane surfaces (Fig. 1 and Table 1), which reduced the adhesion of bacteria and nutrients. In addition, the antimicrobial activity of GO could reduce the cell viability, then inhibit the formation of biofilm on the membrane.27 In contrast, compared with the TFC membrane, the TFN-S exhibited a negligible difference in the water flux behavior. This result indicates that the modification of the support layer with GO for TFC membrane has little effect on biofouling control. The result also shows that only changing the hydrophilicity and roughness of the membrane surface has no significant impact on biofouling mitigation.
Fig. 2. The normalized water flux profile of the pristine and modified membranes during 72 h biofouling experiments.
3.3.2. Analysis of the biofilm composition
Generally, the formation of a biofilm on the surface of the membrane contributes to a decrease in membrane permeation flux. To more deeply understand the biofilm properties, the biofouled membranes of both pristine and GO modified TFC membranes were characterized by EPS, TOC and ATP analyses.
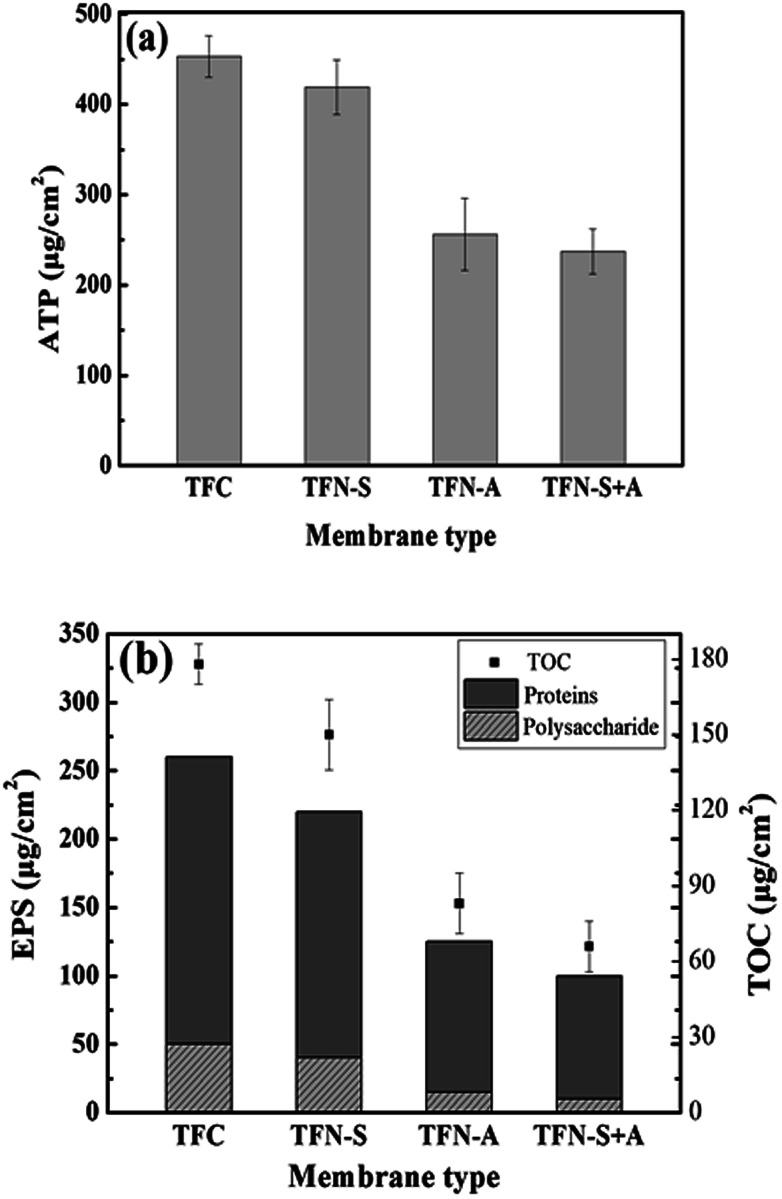
The cell viability on the fouled membranes was assessed using the ATP bioluminescence assay test. The ATP concentrations on the pristine TFC, TFN-S, TFN-A and TFN-S + A membranes were 453, 426, 267, and 241 μg cm−2, respectively (Fig. 3(a)). These results confirmed that the GO-modified active layer of the TFN-A and TFN-S + A membranes have a strong anti-biofouling ability from the combined effects of anti-adhesion from the bacteria during the early stage of biofouling36 and the bactericidal effect at the later stage of biofouling.44 Furthermore, as shown in Fig. 3(b), the EPS concentrations for proteins and polysaccharides on the different membrane surfaces followed the descending order of TFC > TFN-S > TFN-A > TFN-S + A, which was consistent with the results of normalized flux. In addition, the TOC concentrations on the four membranes were analyzed to determine the organic carbon on the membranes after biofouling formation. TOC concentrations were drastically reduced after modification of the active layer with GO. Our results demonstrate that the development of anti-biofouling TFC membranes with the active layer modification benefit from the physicochemical and biological properties of GO.
Fig. 3. Total ATP, EPS and TOC concentration variation on the membrane surface upon biofouling of four membranes. (a) Representative the ATP concentration of the membranes; (b) representative the EPS and the TOC concentration of the membranes.
3.3.3. Biofilm thickness and total cell counts on the membranes determined by CLSM
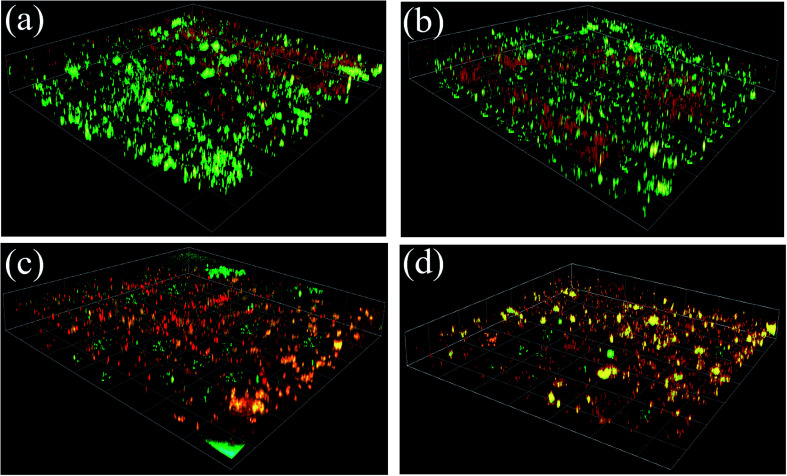
To obtain information regarding biofilm properties, biofouled membranes were characterized using confocal microscopy. The amount of live and dead cells in the biofilm were stained with fluorescence labeling and evaluated using ImageJ, respectively. Fig. 4 represents the three-dimensional structure of the biofilm before and after the functionalization of TFC membranes with GO nanosheets. Both live (represented in green) and dead cells (represented in red) on the fouled surfaces were stained and observed. We can clearly see that there were more cells on the pristine TFC and TFN-S membranes than on the TFN-A and TFN-S + A membranes. Specifically, more dead cells were present on the TFN-A and TFN-S + A membranes (Fig. 4(c and d)), consistent with the results of ATP described above. These results indicate that direct contact with the GO could strongly inhibit bacterial growth.
Fig. 4. The epifluorescence microscopy images of P. aeruginosa cells on four membranes after 72 h filtration. (a) Representative the TFC membrane; (b) representative the TFN-S membrane; (c) representative the TFN-A membrane and (d) representative the TFN-S + A membrane, (the glare area was the overlapping parts of the dead cells and the live cells).
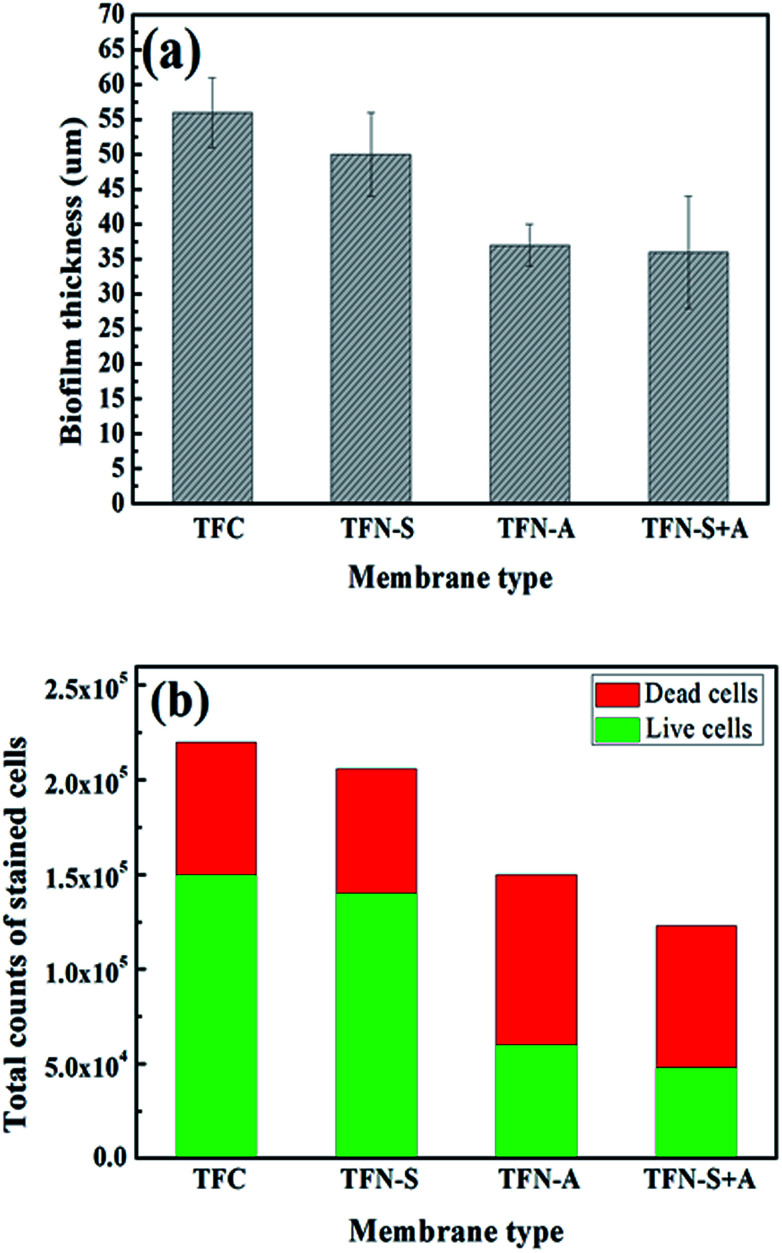
As shown in Fig. 5(a), the biofilm thicknesses on the TFN-A (37 μm) and TFN-S + A (36 μm) membranes were obviously thinner than those on the TFC (56 μm) and TFN-S (50 μm) membranes. This result was mainly attributed to the bactericidal effect and hydrophilicity of GO nanosheets on the membrane surface, which reduced the cell viability and lowered the adhesion ability of microorganisms.45 Furthermore, total cell numbers associated with the TFN-A and TFN-S + A membranes are remarkably lower than those associated with the TFC and TFN-S membranes, and the cell viability inside the biofilm of the TFN-A and TFN-S + A membranes are considerably lower (Fig. 5(b)). In conclusion, biofilm formation on modified membranes was significantly inhibited by the incorporation of GO into PA active layers. The mechanism of this effect is ascribed to the presence of defective edges on the GO nanosheets that provide active sites for the generation of reactive oxygen species that cause stress and result in damage to the bacterial cell membrane.8,32 Therefore, direct contact between the bacterial cells and the membrane surface can end in cellular lysis and subsequently, the impedance of biofilm establishment leading to a significant reduction of biofouling. We draw the conclusion that the addition of GO into the active layer (TFN-A, TFN-S + A) played a key role in mitigating biofilm development on the TFC membranes.
Fig. 5. (a) The biofilm thickness (the error bars represent the standard deviation of three independent measurements); (b) the total counts of stained cells of four fouled membrane.
4. Conclusions
In this paper, the effects of GO on the substrate and active layer of TFC membranes were systematically studied. Both a pristine TFC membrane and GO-functionalized membranes (TFN-S membrane, TFN-A membrane and TFN-S + A membrane) were fabricated and characterized. Then, performance and anti-biofouling ability were compared using an FO system. Our conclusions are summarized as follows:
(1) TFN-S membrane with GO functionalized substrate improves water flux more effectively than active layer modified TFN-A membrane, suggesting that the improvement in pore structure of TFC membrane is more important than the change of surface hydrophilicity to the water flux. On the other hand, the TFN-A membrane exhibited a lower reverse salt flux and higher salt rejection than the TFN-S membrane, indicating that the active layer plays a dominant role for selectivity.
(2) For the biofouling mitigation, TFN-A membrane with stronger hydrophilicity, lower roughness properties could reduce the adhesion of bacteria and nutrients. More importantly, the antimicrobial activity of GO reduces the cell viability and then alleviating the formation of biofilm on the membrane.
(3) Compared to the TFN-S membrane, the TFN-A membrane reduced the flux drop by 15% and had a lower total cell count, EPS and ATP. This advantage of TFN-A in biofouling mitigation suggests that the antibacterial effect of GO has a stronger influence on biofouling control than the changes of hydrophilicity and roughness.
Conflicts of interest
There are no conflicts to declare.
Supplementary Material
Acknowledgments
This study was financially supported by the Beijing Municipal Natural Science Foundation (L182030) and National Natural Science Foundation of China (Grant No. 51708032).
Electronic supplementary information (ESI) available. See DOI: 10.1039/c8ra08838a
References
- She Q. H. Wang R. Fang A. G. Tang C. Y. J. Membr. Sci. 2016;499:201–233. doi: 10.1016/j.memsci.2015.10.040. [DOI] [Google Scholar]
- Akther N. Sodiq A. Giwa A. Daer S. Arafat H. A. Hasan S. W. Chem. Eng. J. 2015;281:502–522. doi: 10.1016/j.cej.2015.05.080. [DOI] [Google Scholar]
- Luo L. Zhou Z. Z. Chung T. S. Weber M. Staudt C. Maletzko C. Environ. Sci. Technol. 2016;50:7696–7705. doi: 10.1021/acs.est.5b06166. [DOI] [PubMed] [Google Scholar]
- Kim D. I. Choi J. Hong S. Sep. Purif. Technol. 2018;191:225–232. doi: 10.1016/j.seppur.2017.09.036. [DOI] [Google Scholar]
- Yi X. Z. Tran N. H. Yin T. R. He Y. L. Gin K. Y. H. Water Res. 2017;121:46–60. doi: 10.1016/j.watres.2017.05.008. [DOI] [PubMed] [Google Scholar]
- Kim S. M. Go G. W. Jang A. J. Ind. Eng. Chem. 2016;33:255–261. doi: 10.1016/j.jiec.2015.10.005. [DOI] [Google Scholar]
- Jamil S. Jeong S. Vigneswaran S. Sep. Purif. Technol. 2016;171:182–190. doi: 10.1016/j.seppur.2016.07.036. [DOI] [Google Scholar]
- Motsa M. M. Mamba B. B. Thwala J. M. D Verliefde A. R. Desalination. 2017;402:62–71. doi: 10.1016/j.desal.2016.09.018. [DOI] [Google Scholar]
- Linares R. V. Bucs S. S. Li Z. AbuGhdeeb M. Amy G. Vrouwenvelder J. S. Water Res. 2014;57:223–233. doi: 10.1016/j.watres.2014.03.046. [DOI] [PubMed] [Google Scholar]
- Ortega-Bravo J. C. Ruiz-Filippi G. Donoso-Bravo A. Reyes-Caniupán I. E. Jeison D. Chem. Eng. J. 2016;306:531–537. doi: 10.1016/j.cej.2016.07.085. [DOI] [Google Scholar]
- Hegab H. M. ElMekawy A. Barclay T. G. Michelmore A. Zou L. Saint C. P. Markovic M. G. ACS Appl. Mater. Interfaces. 2015;7:18004–18016. doi: 10.1021/acsami.5b04818. [DOI] [PubMed] [Google Scholar]
- Xie M. Gray S. R. Sep. Purif. Technol. 2016;167:6–16. doi: 10.1016/j.seppur.2016.04.044. [DOI] [Google Scholar]
- Yoon H. Baek Y. B. Yu J. Yoon J. Desalination. 2013;325:30–36. doi: 10.1016/j.desal.2013.06.018. [DOI] [Google Scholar]
- Li C. Yang Y. Ding S. Y. Hou L. A. J. Membr. Sci. 2016;514:264–273. doi: 10.1016/j.memsci.2016.04.066. [DOI] [Google Scholar]
- Wang X. Wang X. Z. Xiao P. Li J. Tian E. Zhao Y. T. Ren Y. W. Colloids Surf., A. 2016;508:327–335. doi: 10.1016/j.colsurfa.2016.08.077. [DOI] [Google Scholar]
- Khorshidi B. Bhinder A. Thundat T. Pernitsky D. Sadrzadeh M. J. Membr. Sci. 2016;511:29–39. doi: 10.1016/j.memsci.2016.03.052. [DOI] [Google Scholar]
- Xie M. Gray S. R. J. Membr. Sci. 2016;513:250–259. doi: 10.1016/j.memsci.2016.04.022. [DOI] [Google Scholar]
- Shen L. Xiong S. Wang Y. Chem. Eng. Sci. 2016;143:194–205. doi: 10.1016/j.ces.2015.12.029. [DOI] [Google Scholar]
- Bell E. A. Poynor T. E. Newhart K. B. Regnery J. Coday B. D. Cath T. Y. J. Membr. Sci. 2017;525:77–88. doi: 10.1016/j.memsci.2016.10.032. [DOI] [Google Scholar]
- H Huang M. Chen Y. S. Huang C. H. Sun P. Z. Crittenden J. Chem. Eng. J. 2015;279:904–911. doi: 10.1016/j.cej.2015.05.078. [DOI] [Google Scholar]
- Sergio M. T. Carla M. P. E. JoseL F. Adrian M. T. S. J. Membr. Sci. 2016;520:326–336. doi: 10.1016/j.memsci.2016.07.009. [DOI] [Google Scholar]
- Tiraferri A. Kang Y. Giannelis E. P. Elimelech M. ACS Appl. Mater. Interfaces. 2012;4:5044–5053. doi: 10.1021/am301532g. [DOI] [PubMed] [Google Scholar]
- Wang Z. H. Yu H. R. Xia J. F. Zhang F. F. Li F. Xia Y. Z. Li Y. H. Desalination. 2012;299:50–54. doi: 10.1016/j.desal.2012.05.015. [DOI] [Google Scholar]
- Li G. J. Law W. C. Chan K. C. Green Chem. 2018;20:3689–3695. doi: 10.1039/C8GC01347K. [DOI] [Google Scholar]
- Park M. J. Phuntsho S. He T. Nisola G. M. Tijing L. D. Li X. M. Chen G. Chung W. J. Shon H. K. J. Membr. Sci. 2015;493:496–507. doi: 10.1016/j.memsci.2015.06.053. [DOI] [Google Scholar]
- Kim J. C. Suh D. W. Kim C. S. B Baek Y. Lee B. Kim H. J. C Lee J. Yoon J. Desalination. 2016;397:157–164. doi: 10.1016/j.desal.2016.07.002. [DOI] [Google Scholar]
- Perreault F. Jaramillo H. Xie M. Ude M. Nghiem L. D. Elimelech M. Environ. Sci. Technol. 2016;50:5840–5848. doi: 10.1021/acs.est.5b06364. [DOI] [PubMed] [Google Scholar]
- Castrillon S. R. V. Perreault F. Faria A. F. Elimelech M. Environ. Sci. Technol. 2015;2:112–117. [Google Scholar]
- Faria A. F. Liu C. H. Xie M. Perreault F. Nghiem L. D. Ma J. Elimelech M. J. Membr. Sci. 2017;525:146–156. doi: 10.1016/j.memsci.2016.10.040. [DOI] [Google Scholar]
- Hu M. X Zheng S. Mi B. X. Environ. Sci. Technol. 2016;50:685–693. doi: 10.1021/acs.est.5b03916. [DOI] [PubMed] [Google Scholar]
- Emadzadeh D. Lau W. J. Matsuura T. Hilal N. Ismail A. F. Desalination. 2014;348:82–88. doi: 10.1016/j.desal.2014.06.008. [DOI] [Google Scholar]
- Zhang X. Y. Tian J. Y. Ren Z. J. Shi W. X. Zhang Z. B. Xu Y. P. Gao S. S. Cui F. Y. J. Membr. Sci. 2016;520:529–539. doi: 10.1016/j.memsci.2016.08.005. [DOI] [Google Scholar]
- Hegab H. M. Mekawy A. E. Barclay T. G. Michelmore A. Zou L. Saint C. P. Ginic-Markovic M. Desalination. 2016;385:126–137. doi: 10.1016/j.desal.2016.02.021. [DOI] [Google Scholar]
- Morales-Torres S. Esteves C. M. P. Figueiredo J. L. Silva A. M. T. J. Membr. Sci. 2016;520:326–336. doi: 10.1016/j.memsci.2016.07.009. [DOI] [Google Scholar]
- Lim S. Park M. J. Phuntsho S. Tijing L. D. Nisola G. M. Shim W. G. Chung W. J. Shon H. K. Polymer. 2017;110:36–48. doi: 10.1016/j.polymer.2016.12.066. [DOI] [Google Scholar]
- Chae H. R. Lee C. H. Park P. K. Kim I. C. Kim J. H. J. Membr. Sci. 2017;525:99–106. doi: 10.1016/j.memsci.2016.10.034. [DOI] [Google Scholar]
- Ekambaram K. Doraisamy M. Desalination. 2016;385:24–38. doi: 10.1016/j.desal.2016.01.029. [DOI] [Google Scholar]
- Lu P. Liang S. Zhou T. T. Mei X. Y. Zhang Y. Zhang C. Umar A. Wang Q. RSC Adv. 2016;6:56599–56609. doi: 10.1039/C6RA10080E. [DOI] [Google Scholar]
- Krishnan S. Weinman C. J. Ober C. K. J. Mater. Chem. 2008;18:3405–3413. doi: 10.1039/B801491D. [DOI] [Google Scholar]
- Wei J. Li Y. Setiawan L. Wang R. J. Membr. Sci. 2016;511:54–64. doi: 10.1016/j.memsci.2016.03.046. [DOI] [Google Scholar]
- Lee J. Chae H. R. Won Y. J. Lee K. Lee C.-H. Lee H. H. Kim I.-C. Lee J. J. Membr. Sci. 2013;448:223–230. doi: 10.1016/j.memsci.2013.08.017. [DOI] [Google Scholar]
- Tian M. Qiu C. Q. Liao Y. Chou S. Wang R. Sep. Purif. Technol. 2013;118:727–736. doi: 10.1016/j.seppur.2013.08.021. [DOI] [Google Scholar]
- Xie M. Lee J. Nghiem L. D. Elimelech M. J. Membr. Sci. 2015;493:748–754. doi: 10.1016/j.memsci.2015.07.033. [DOI] [Google Scholar]
- Perreault F. Tousley M. E. Elimelech M. Environ. Sci. Technol. Lett. 2014;1:71–76. doi: 10.1021/ez4001356. [DOI] [Google Scholar]
- Wang Z. H. Yu H. R. Xia J. F. Zhang F. F. Li F. Xia Y. Z. Li Y. H. Desalination. 2012;299:50–54. doi: 10.1016/j.desal.2012.05.015. [DOI] [Google Scholar]
Associated Data
This section collects any data citations, data availability statements, or supplementary materials included in this article.


