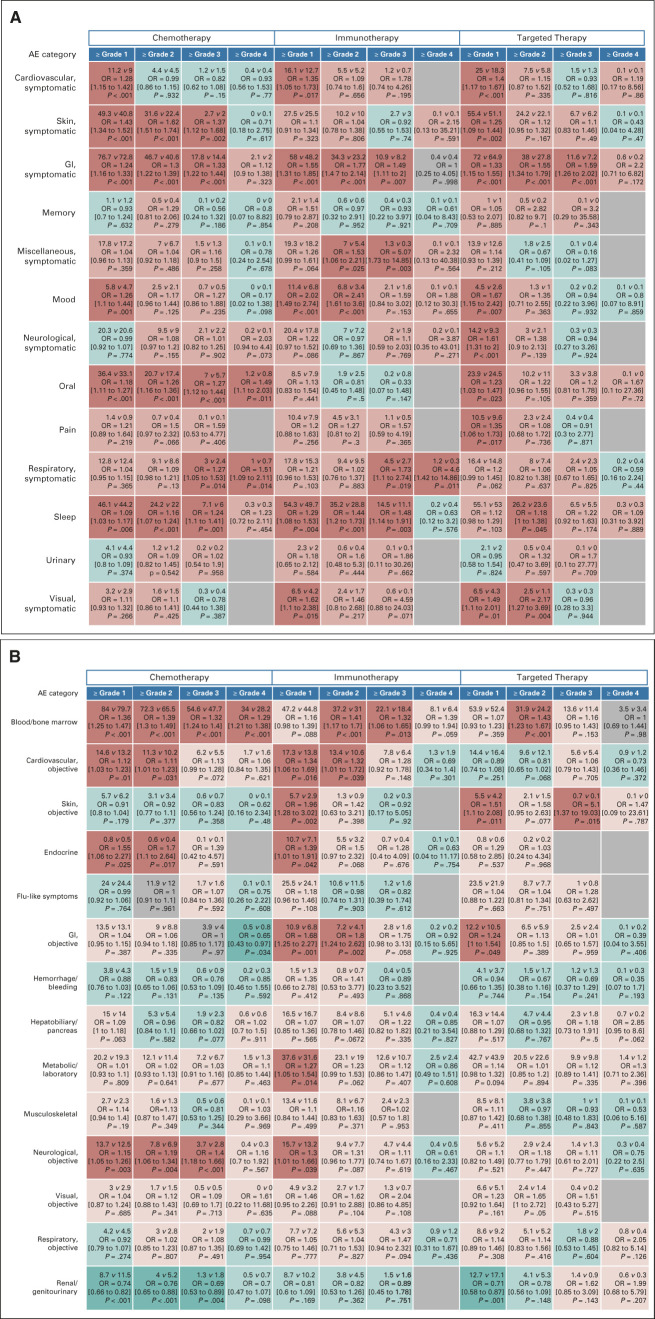
FIG 4.
Risk of AEs by sex for individual AE categories by the treatment domain and grade cut point. For each AE, the proportion of patients with grade ≥ 1 through ≥ 4 AEs was analyzed in a logistic regression model, adjusted for covariates. (A) Symptomatic AEs and (B) objective AEs. Within each cell, the observed percentage of women versus men experiencing at least the indicated grade level of AE, with the corresponding multivariable logistic regression model ORs, 95% CIs, and P-values, are shown. OR > 1.0 indicates greater risk of a given AE at the cut point level within the specific treatment domain for females and < 1.0 for males. Instances where women had greater odds of AEs than men are coded red, with blue indicating the reverse and gray indicating no difference or missing because of lack of events. The color intensity corresponds to greater divergence by sex in a given direction; thus, the darker red or darker blue indicates statistically significant (P < .05) findings and lighter red and blue indicate nonstatistically significant trends in favor of greater risk for females and males, respectively. The depiction thus represents a heat map of toxicity outcomes. The predominance of red over blue coloring indicates a generalized pattern of worse AE outcomes for women than men. AE, adverse event; OR, odds ratio.

