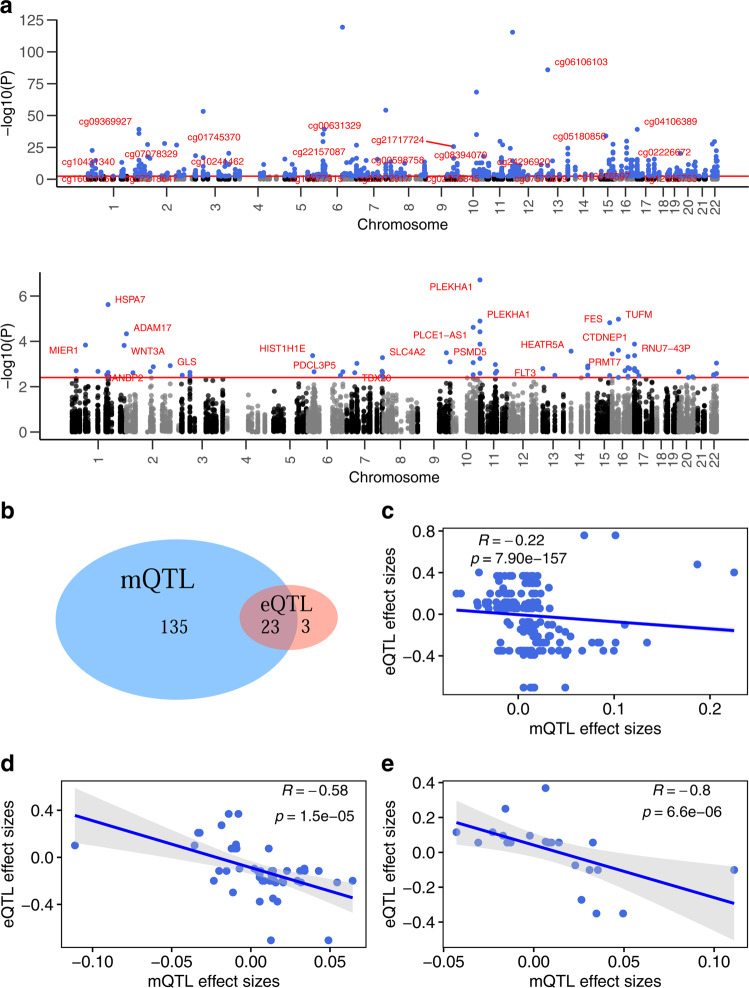
Fig. 2. Birthweight-associated genetic variants with co-occurring cis-eQTL and cis-mQTL effect.
a mQTL in the upper panel and eQTL in the lower panel. The red horizontal lines represent the 5% FDR threshold. CpGs and genes with labels correspond to loci in which a genetic variant was associated with both DNA methylation and gene expression. For ease of readability, only one CpG and one gene was labeled per locus. b Venn Diagram showing the number of birthweight GWAS loci that were found to be eQTL and mQTL in the placenta. c–e P is based on a two-sided Spearman correlation test performed between placental mQTL and eQTL association coefficients for all 197 eQTL-mQTL triplets (c), for 48 triplets consisting DNA methylation sites within the eQTL target genes (d), and for 23 triplets that overlap with blood eQTL from GTEx and mQTL from ARIES database (e). d, e Error bands in gray represent standard error of the mean.

