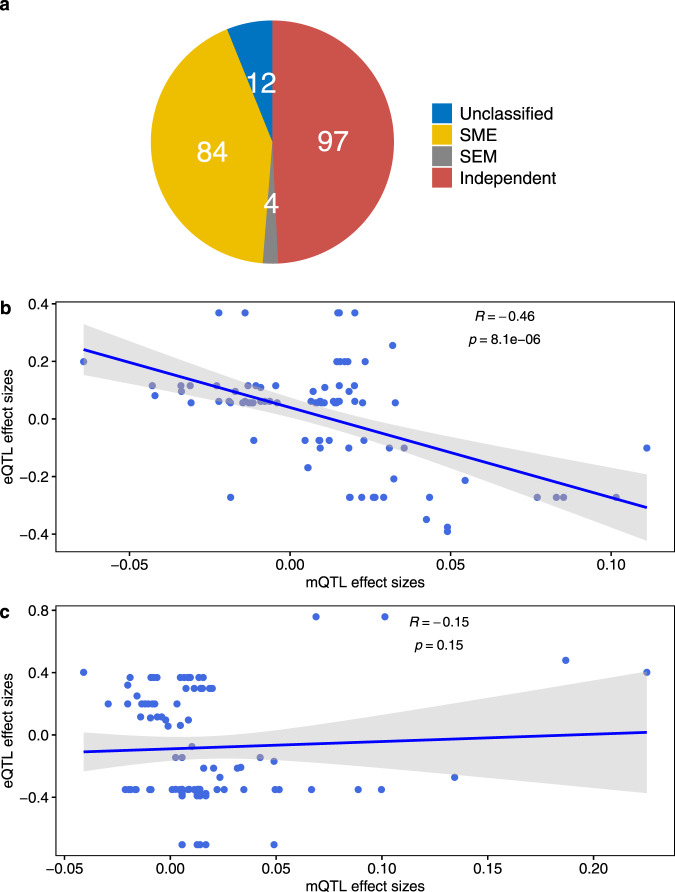
Fig. 3. Causal inference test result.
a Pie-chart showing the number of eQTL-mQTL triplets predicted as “SEM” mediation representing SNP effect mediated via placental gene expression on nearby DNA methylation, “SME” mediation representing SNP effect mediated via placental DNA methylation on placental gene expression, “independent SE/SM” effect denoting SNP effect on placental DNA methylation and gene expression via independent pathways, and “unclassified” relationship. b, c Error bands in gray represent standard error of the mean and P is based on a two-sided Spearman correlation test. The dose-response correlation between eQTL and mQTL association coefficients was only significant for triplets with SEM or SME predicted causal relationship (b) but not with independent SE/SM relationship (c).

