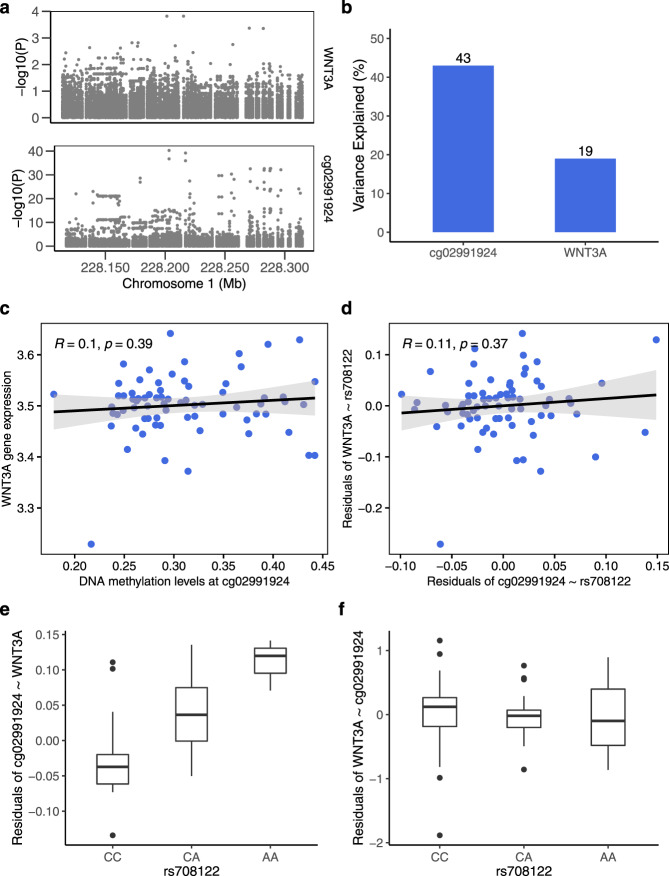
Fig. 4. Direction of the relationship between birthweight-associated SNP, DNA methylation and WNT3A gene expression in placenta.
a Association between all SNPs 100 kb up- and downstream of the birthweight GWAS SNP rs708122 and WNT3A gene expression (upper panel) and DNA methylation at cg02991924 (lower panel). The strongest association was found for the index SNP or its nearest linkage disequilibrium (LD) proxies. b rs708122 accounts for higher variance in DNA methylation than in WNT3A expression based on MR Steiger test. c, d Error bands in gray represent standard error of the mean and P is based on a two-sided Spearman correlation test. DNA methylation and WNT3A expression were not correlated. e, f Box plots indicate median (middle line), 25th, 75th percentile (box) and 5th and 95th percentile (whiskers) as well as outliers (single points). N = 71 individuals. rs708122 was associated with DNA methylation after regressing out WNT3A expression (e) (Kruskal Wallis test P = 3.06 × 10⁻⁷) but was not associated with residuals of WNT3A after regressing out DNA methylation (f) (Kruskal Wallis test P = 0.57).

