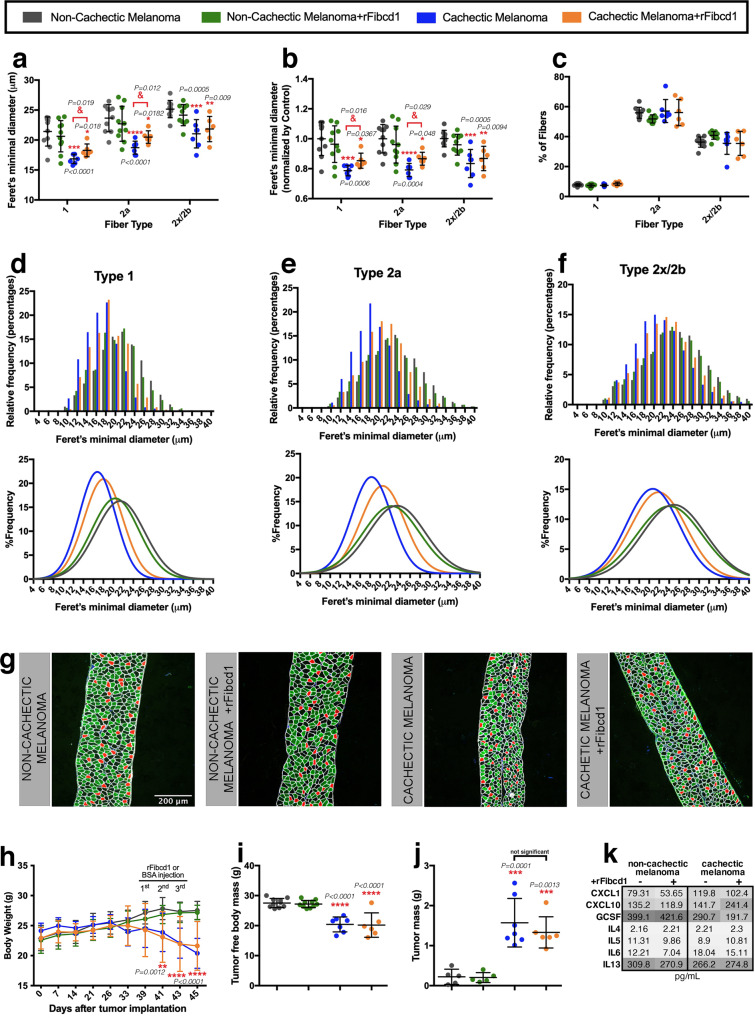
Fig. 6. rFibcd1 rescues diaphragm myofiber atrophy induced by a patient-derived melanoma xenograft.
a–f Myofiber size from diaphragms of control mice with a non-cachectic melanoma and treated with mock (n = 10) or with rFibcd1 (n = 10), and from mice that carry a cachectic melanoma and are treated with mock (n = 7) or with rFibcd1 (n = 6). Treatment with rFibcd1 consisted of 3 intraperitoneal injections of rFibcd1 (3 mg/Kg) or of the vehicle (1% BSA). a Feret’s minimal diameter of type 1, 2a, and 2x/2b myofibers. b Feret’s minimal diameter normalized to controls. c Percentage of type 1, 2a, and 2x/2b myofibers. In a–c, mean values ± SD are shown, and were analyzed with two-way ANOVA with Sidak’s multiple comparisons and with two-tailed unpaired t-tests. d–f Frequency and gaussian distribution of Feret’s minimal diameters for type 1 d, type 2a e, and type 2x/2b myofibers f. g Representative micrographs of diaphragm strips immunostained for type 1 (red), type 2a (green), and type 2x/2b myofibers (black). Laminin (white) delineates myofibers, and DAPI (blue) the nuclei. h–i Body weight and tumor-free body mass progressively decline in response to growth of a cachectic melanoma but not in response to a control non-cachectic melanoma. h-j, Intraperitoneal injection of rFibcd1 does not affect the body weight, tumor-free body mass, and the tumor mass, indicating that rFibcd1 does not rescue myofiber atrophy by impacting tumor growth and general body wasting. In h–j data are mean ± SD; ***P < 0.0001 compared to control non-cachectic melanoma group; &P < 0.05 compared to the control cachectic melanoma group. Statistical analysis was done by using two-way ANOVA with Tukey’s multiple comparisons test and two-tailed unpaired t-test. See also Supplementary Fig. 5. k Heatmap showing the levels of cytokines (pg/mL) from the plasma of mice from the groups described above. Lack of Fibcd1 treatment is indicated by a (−), whereas (+) denotes rFibcd1 administration. Color key indicates low plasma levels (light gray) and high plasma levels (high gray) of cytokines. See also Supplementary Fig. 7. Source data are provided in the Source Data file.

