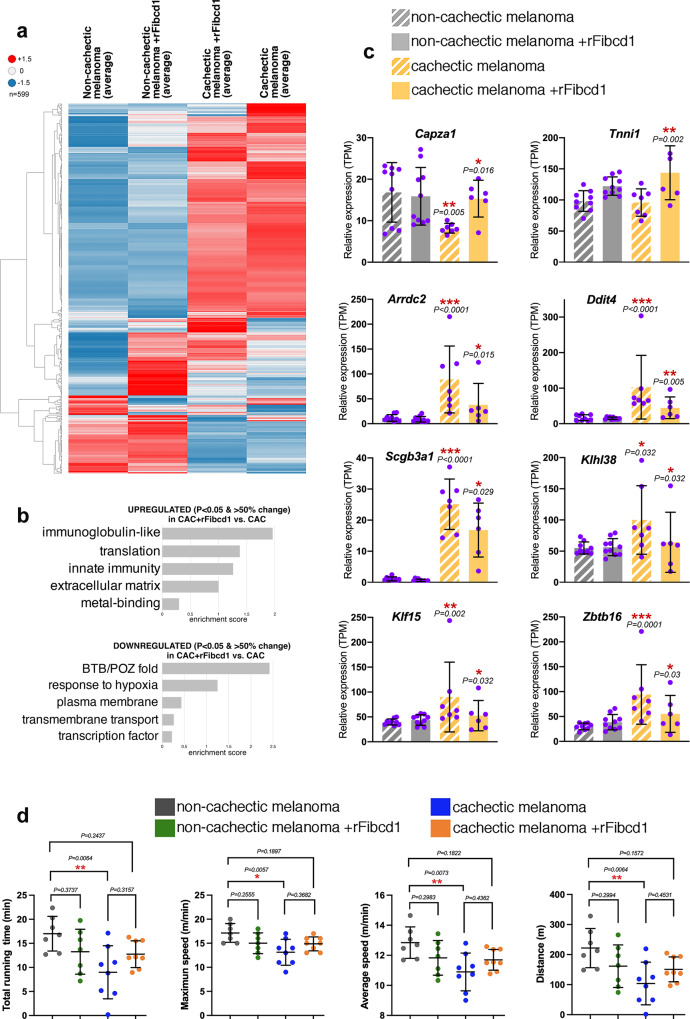
Fig. 7. rFibcd1 reduces transcriptional and functional changes induced by cachectic melanomas.
a Heatmap of 599 genes that are differentially expressed in diaphragm muscles of mice bearing non-cachectic melanomas and either mock-treated (n = 9) or treated with rFibcd1 (n = 10), and mice that carry a cachectic melanoma and that are either mock-treated (n = 7) or treated with rFibcd1 (n = 6). rFibcd1 represses some of the gene expression changes that characterize diaphragms from mice implanted with cachectic versus the non-cachectic melanomas. The heatmaps are based on z-scores of group averages from baseline-adjusted log2(TMP) for genes with at least one significant call among the related comparison sets. b GO term analysis of genes that are significantly regulated (34 upregulated, 32 downregulated; P < 0.05 and 50% change; Supplementary Data 5) in the diaphragm of mice with cachectic melanomas, treated with rFibcd1 versus mock. c Expression of genes related to myofiber atrophy from dataset in b and Supplementary Data 5. Data are means ± SD. P values were determined as reported in the RNA-seq methods and refer to cachectic versus non-cachectic, and to cachectic+rFibcd1 versus cachectic; *P < 0.05, **P < 0.01, ***P < 0.001. The N refers to diaphragm muscles and it is indicated in the legend of a. d Analysis of motor function in mice with either cachectic or non-cachectic orthotopic melanoma xenografts, and which received 3 i.p. injections of either rFibcd1 or mock (BSA) a week before testing. Melanoma-induced cachexia significantly reduces motor function compared to mice implanted with non-cachectic cancer cells. Comparison of the treadmill capacity of rFibcd1- versus mock-treated cachectic mice shows a trend towards improved treadmill performance in response to rFibcd1 injection but this difference does not reach statistical significance. However, cachectic mice treated with rFibcd1 have a treadmill capacity that is also not statistically different from that of non-cachectic mice. Data are means ± SD, with mice bearing non-cachectic melanomas and either mock-treated (n = 7) or treated with rFibcd1 (n = 7), and mice bearing cachectic melanomas and either mock-treated (n = 8) or treated with rFibcd1 (n = 8). P values were determined by one-way ANOVA with Tukey’s post hoc test; *P < 0.05 and **P < 0.01. Source data are provided in the Source Data file.

