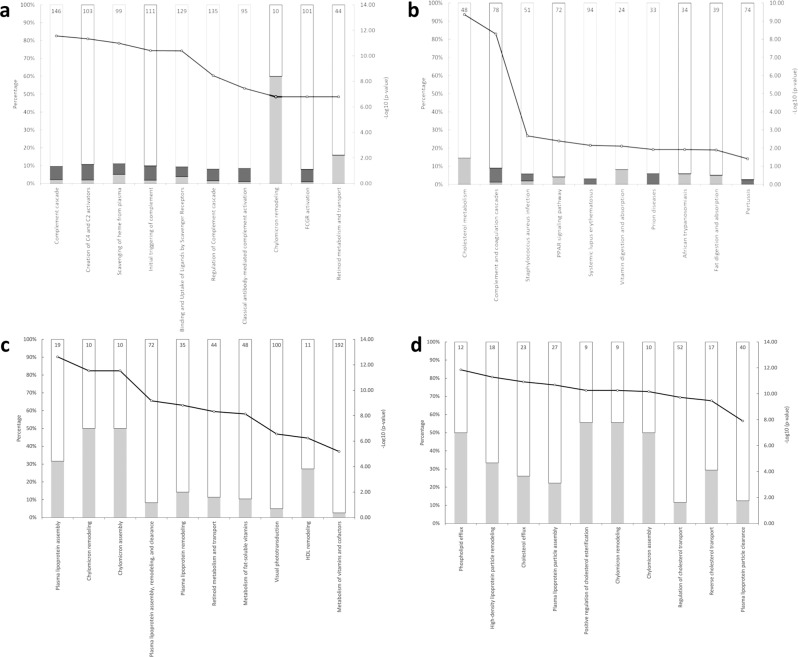
Fig. 3. Enriched pathways between COVID-19 ARDS and Healthy Group.
Top 10 enriched pathways for the 52 differentially expressed proteins based on the unadjusted p value and fold-change comparison between COVID-19 ARDS Group and Healthy Group, ranked in increasing order of their p values (determined using two-sided t test) from left-to-right. (a Reactome pathway analysis; b STRING pathway analysis). Top 10 enriched pathways for the 17 differentially expressed proteins based on the adjusted p value (using two-sided t test adjusted for multiple comparison with Benjamini-Hochberg correction) comparison between COVID-19 ARDS Group and Healthy Group, ranked in increasing order of their p values from left-to-right. (c Reactome pathway analysis; d STRING pathway analysis). The size of the bar in each graph indicates the proportion of proteins in that pathway that are up- or down-regulated in our study, the number reported at the top of each bar is the specific number of proteins in that pathway affected. Dark grey: proteins with relative increased expression in COVID-19 ARDS Group; Light grey: proteins with relative decreased expression in COVID-19 ARDS Group. Black line with a white circle: -Log10 (p value). Indicated pathways suggest biological pathways that are most impacted as a result of COVID-19 ARDS.

