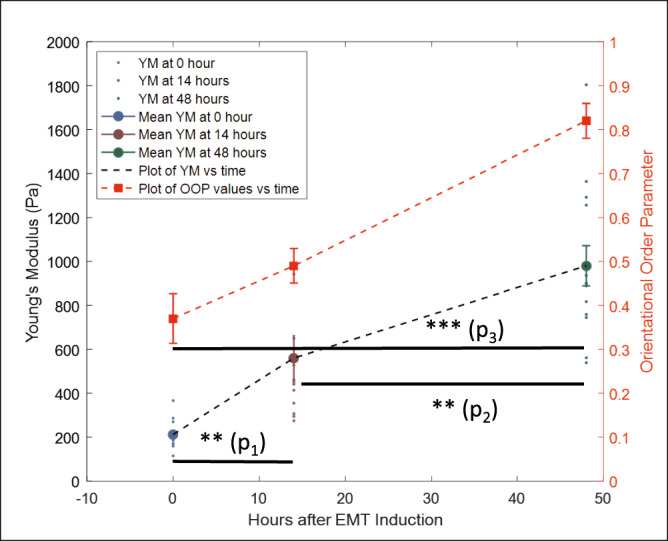
Fig. 5. Measurement of elastic properties of cells.

Young’s Modulus values at 0 (blue) (n = 15), 14 (brown) (n = 13), and 48 (green) (n = 14) hours after EMT induction using TGFβ1 showing their mean and standard errors along with a plot of the mean values. Young’s modulus values were extracted from AFM force curve measurements. Plot of mean OOP values for cell populations against hours after EMT (red) showing mean values and standard errors at 0, 14, and 48 h timepoints. Sample sizes for OOP values are same as reported in Fig. 1g. *P < 0.05, **P < 0.01, ***P < 0.001. P1 = 0.0012, P2 = 0.0048, P3 = 3.6 × 10⁻⁹.
