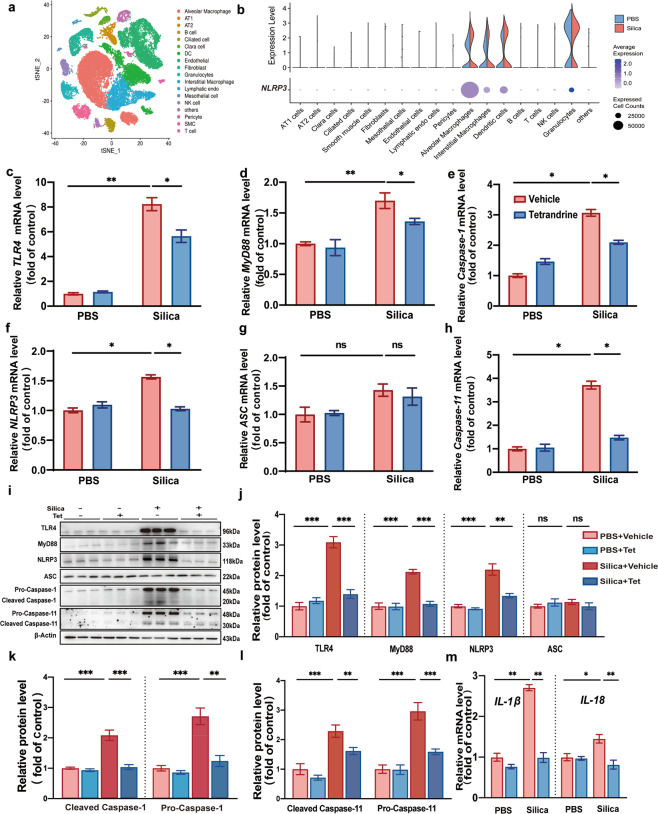
Fig. 5. Tet restrained NLRP3 inflammasome activation in macrophages.
a Cell cluster analysis in PBS and silicosis murine lung tissue. b Violin plots representing heterogeneity in expression of NLRP3 in different cell types from control and silicosis lung tissue. c-h The mRNA levels of TLR4, MyD88, Caspase-1, NLRP3, ASC, and Caspase-11 in macrophages from four groups (PBS + Vehicle, PBS + Tet, Si + Vehicle, and Si + Tet groups). i Western blots of TLR4, MyD88, NLRP3, ASC, Pro-Caspase-1, Cleaved Caspase-1, Pro-Caspase-11, and Cleaved Caspase-11 in macrophages in four groups. j–l Statistical analysis of band densities from images in (i). m mRNA levels of IL-1β and IL-18 in macrophages in four groups. The data are reported as the mean ± SEM. Significance for each figure: *P < 0.05, **P < 0.01, ***P < 0.001 and ns indicates not significant.

