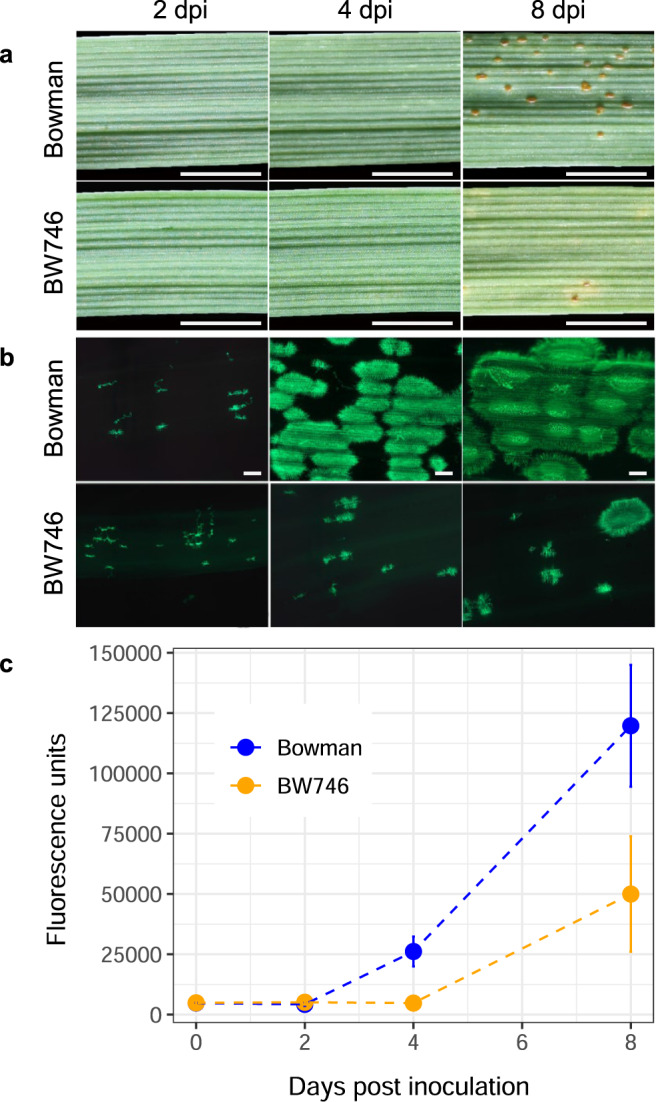
Fig. 1. Development of Puccinia hordei in leaves of cv.

Bowman (rph3) compared to its near-isogenic line BW746 (Rph3). a Segments of infected leaves of cv. Bowman (top) and BW746 (bottom) at 2, 4, and 8 dpi. The scale bar is 0.5 cm. The photos were taken from the same leaves throughout the timepoints. The experiment was repeated five times with similar results. b Microscopic visualization of WGA-FITC-stained fungal colonization of mesophyll cells of cv. Bowman and BW746 leaves at 2, 4, and 8 dpi. The scale bar is 200 µm. c Quantification of P. hordei growth in cv. Bowman and BW746 leaves by the wheat germ agglutinin chitin assay. Fluorescence values for cv. Bowman are shown as blue dots; those from BW746 shown as orange dots. Values represent means ± SD (shown as the error bars) (n = 4).
