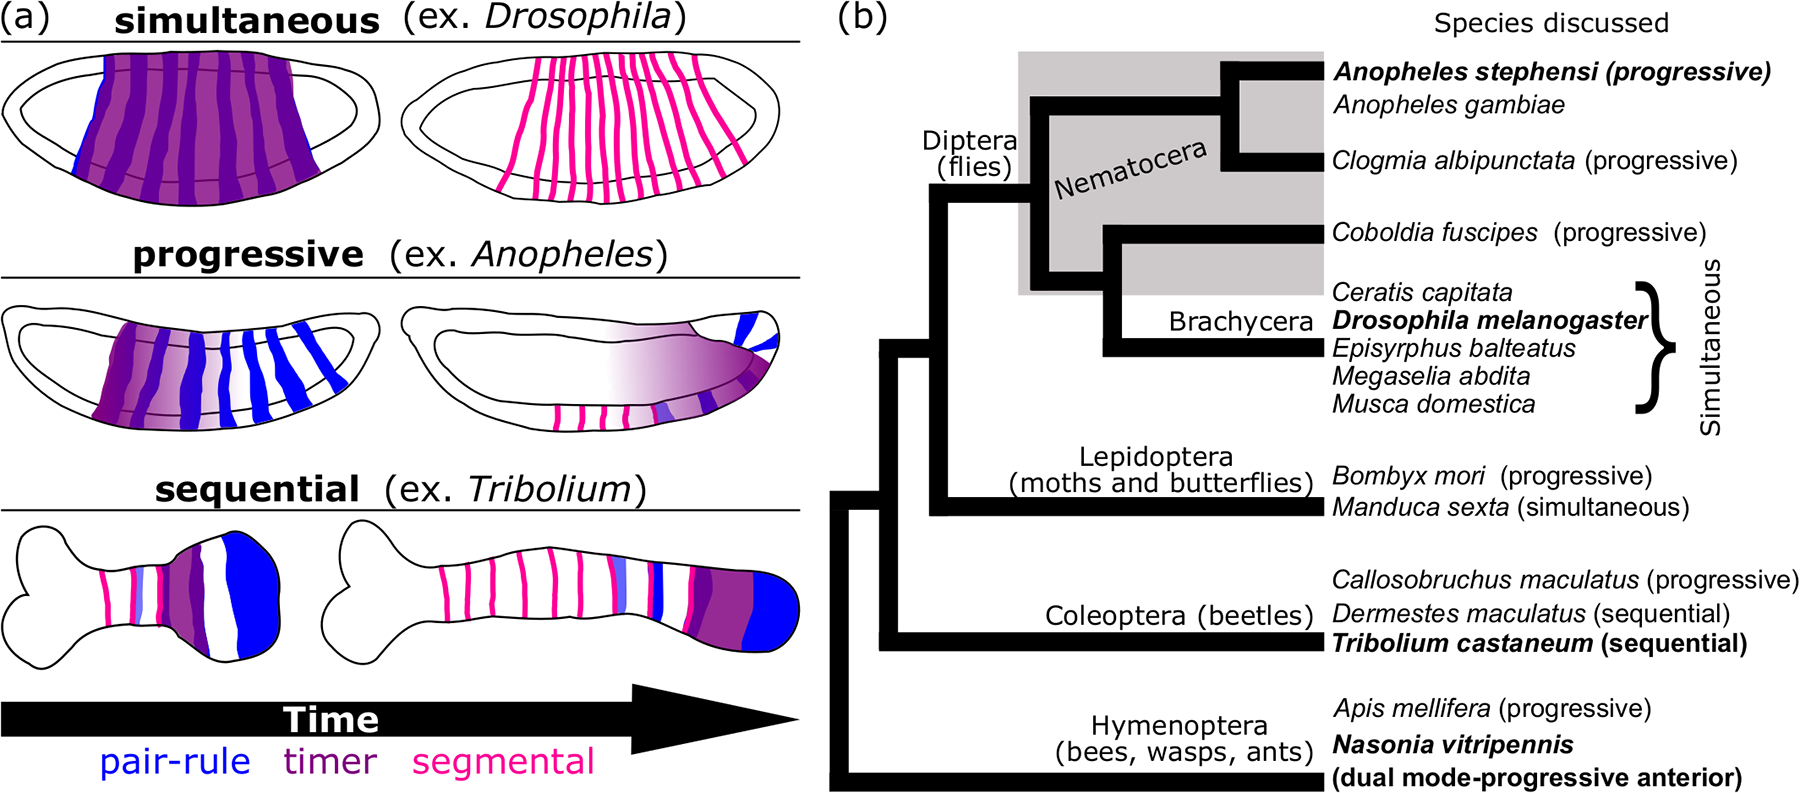
Figure 6: Evolutionary relationships among discussed insect species and their segmentation modes.

a) A schematic depicting each of the segmentation modes discussed in this work. Simultaneous (top), progressive (middle) and sequential (bottom) modes are depicted as characterized in the listed insect model (parentheses). General co-expression patterns of pair-rule (blue), timer (purple) and segmental (pink) genes are shown in representative locations on each embryo cartoon. For each mode, two embryo stages are shown, but note that the amount of time between the first and second stage is not the same for each mode. Each embryo is drawn with the anterior side on the left and the posterior on the right. (b) A cladogram depicting evolutionary relationships among holometabolous insects with major clades denoted. The paraphyletic grouping “Nematocera” is indicated by a gray box around included taxa. Species mentioned in the main text are listed and species discussed with great frequency are written in bold. Next to each species name, the presumptive segmentation mode is listed in parentheses. Modes are designated based on our assessment of the available literature (see Discussion and references therein).
