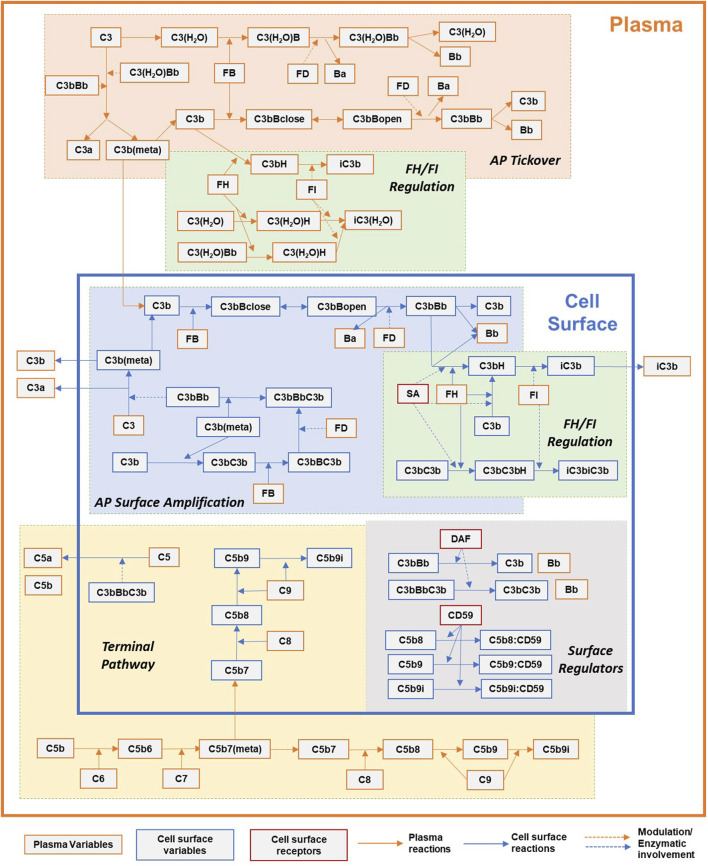
FIGURE 1.
Simplified overview of the processes in the complement pathway model for plasma and cell surface reactions. Key processes shown here: alternative pathway (AP) tickover, regulation by FH and FI in plasma and cell surface, AP surface amplification, terminal pathway, and surface regulators: sialic acid, DAF, and CD59. Dynamics for binding of complement proteins to Properdin are not included here for simplicity and represented separately in Figure 2. Other key processes included in the model but not shown here: dynamics of regulation by CR1, clusterin, and vitronectin.

