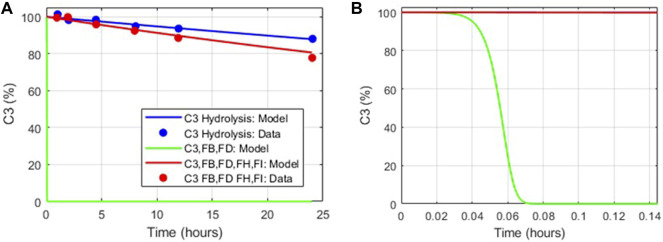
FIGURE 4.
Comparison of the tickover complement model dynamics with in vitro data (Pangburn et al., 1981). (A) Model simulations match in vitro data for C3 hydrolysis alone (blue), with FB, FD added (green) and with FH, FI, FB, and FD added (red). (B) Zoomed in view of model simulations for decay in C3 hemolytic activity in the presence of FB, FD (green).

