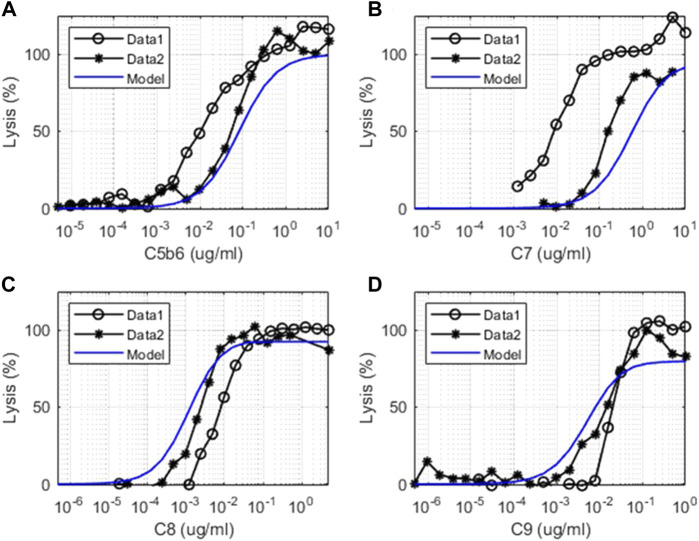
FIGURE 6.
Comparison of model simulations with in vitro assay data for terminal pathways. Model simulation results are denoted by solid blue line, and the terminal pathway assay results are from two sets of independent, identical experiments denoted as “Data 1” (o) and “Data 2” (*). Dose–response of cell lysis is shown for different concentrations of (A) C5b6 (μg/ml), (B) C7 (μg/ml), (C) C8 (μg/ml), and (D) C9 (μg/ml).

