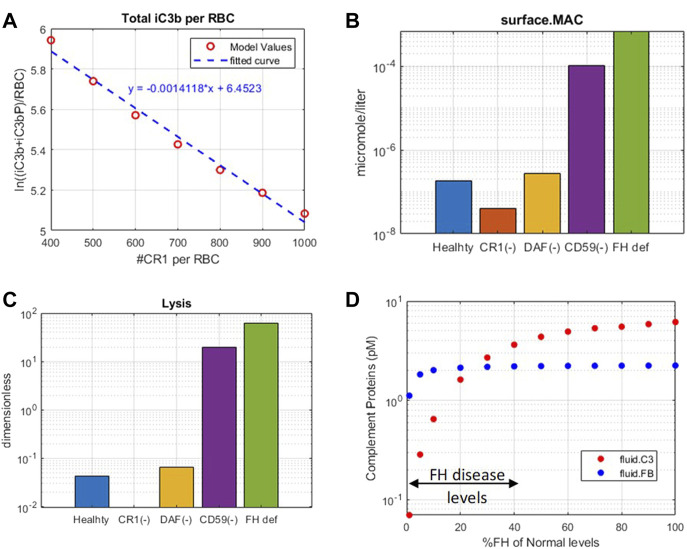
FIGURE 8.
Complement model predictions for (A) correlation between iC3b + iC3bP deposition on erythrocytes and levels of CR1, (B) surface MAC, (C) lysis of host erythrocytes due to 99% reduction in CR1, DAF, and CD59 and 50% reduction in fluid-phase regulator FH, and (D) consumption of complement proteins C3 and FB due to FH deficiency ranging from 0 to 99%.

