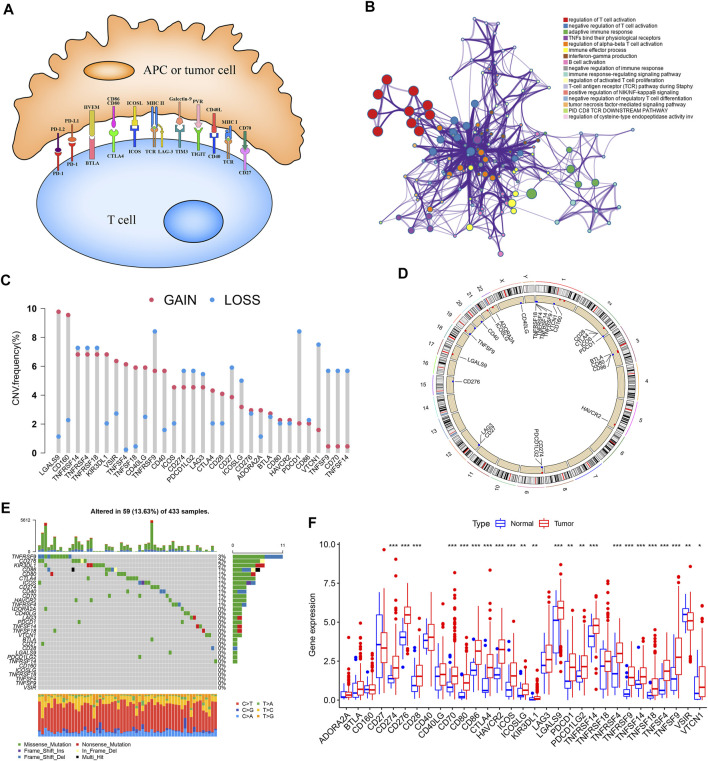
FIGURE 1.
Landscape of genetic and expression variation of ICGs in GC. (A) Interaction of several specific immune checkpoint molecules. (B) Potential biological function enrichment of 31 ICGs. (C) The CNV variation frequency of ICGs in TCGA-STAD cohort. (D) The location of CNV alteration of ICGs on 23 chromosomes in TCGA-STAD cohort. (E) The mutation frequency of 31 ICGs in GC patients from TCGA-STAD cohort. (F) The expression of 31 ICGs between normal tissues and GC tissues. *p < 0.05, **p < 0.01, ***p < 0.001.

