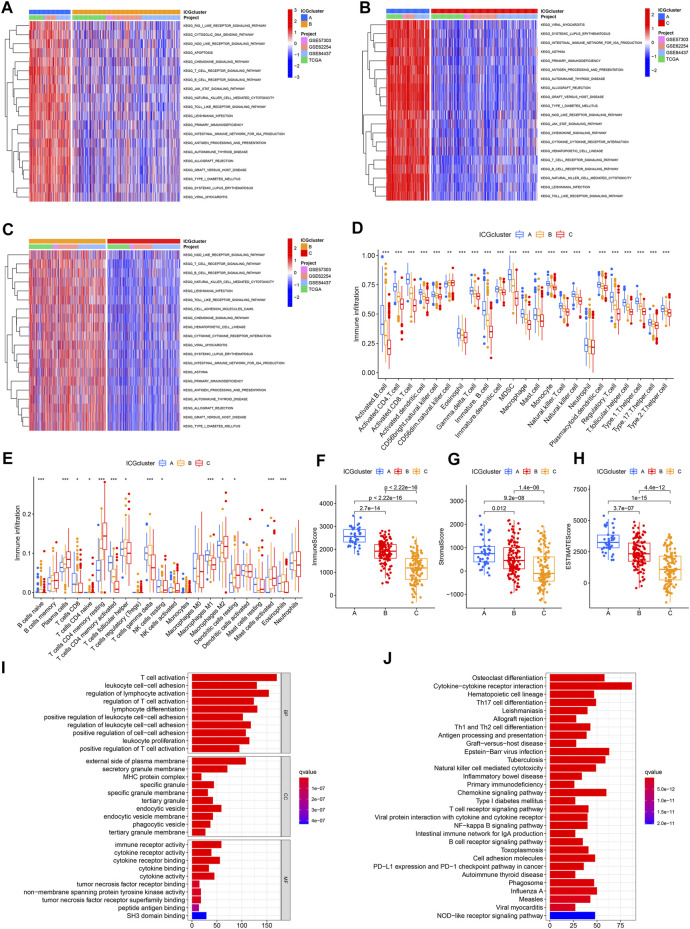
FIGURE 3.
Functional enrichment analysis of three immune checkpoint regulation patterns. (A–C) GSVA enrichment analysis showing the activation states of biological pathways in distinct immune checkpoint regulation patterns. (D) The abundance of each TME infiltrating cell in three immune checkpoint regulation patterns using ssGSEA. (E) The abundance of immune cell infiltration of GSE62254 cohort using CIBERSORT. (F–H) The contents of immune cells and stromal cells in GC samples of GSE62254 cohort using ESTIMATE. (I,J) Functional annotation for immune checkpoint-related genes using GO and KEGG enrichment analysis.

