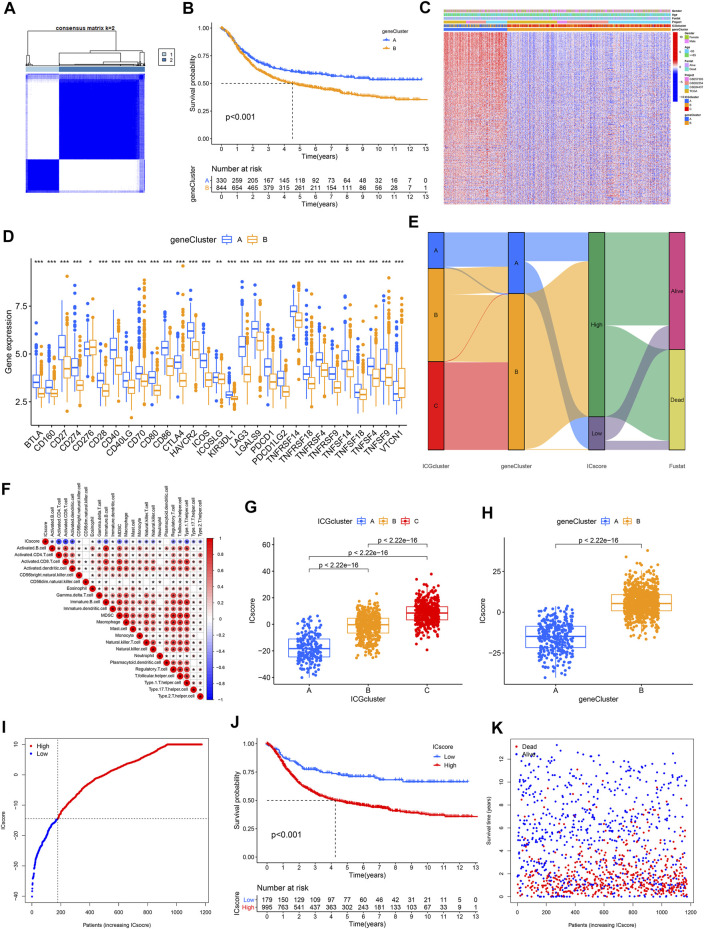
FIGURE 4.
Establishment of ICscore signatures. (A) Consistent clustering matrices based on 1,248 immune checkpoint-related genes for k = 2. (B) Survival analyses for immune checkpoint gene signatures based on 1174 GC patients. (C) Unsupervised clustering of overlapping immune checkpoint-related genes to classify patients into two genomic subtypes. (D) The expression of 31 ICGs in two clusters. (E) Alluvial diagram showing the changes of ICGcluster, geneCluster, ICscore and survival status. (F) Correlations between ICscore and the TME infiltrating cell. (G–H) Differences in ICscore among three ICGclusters and geneClusters. (I) GC patients were divided into two subgroups according to the optimal cutoff value of ICscore. (J) Survival analyses for low and high ICscore patient groups. (K) Survival distribution of low and high ICscore patient groups.

