. 2019 Mar 18;9(16):8778–8881. doi: 10.1039/c8ra09577a

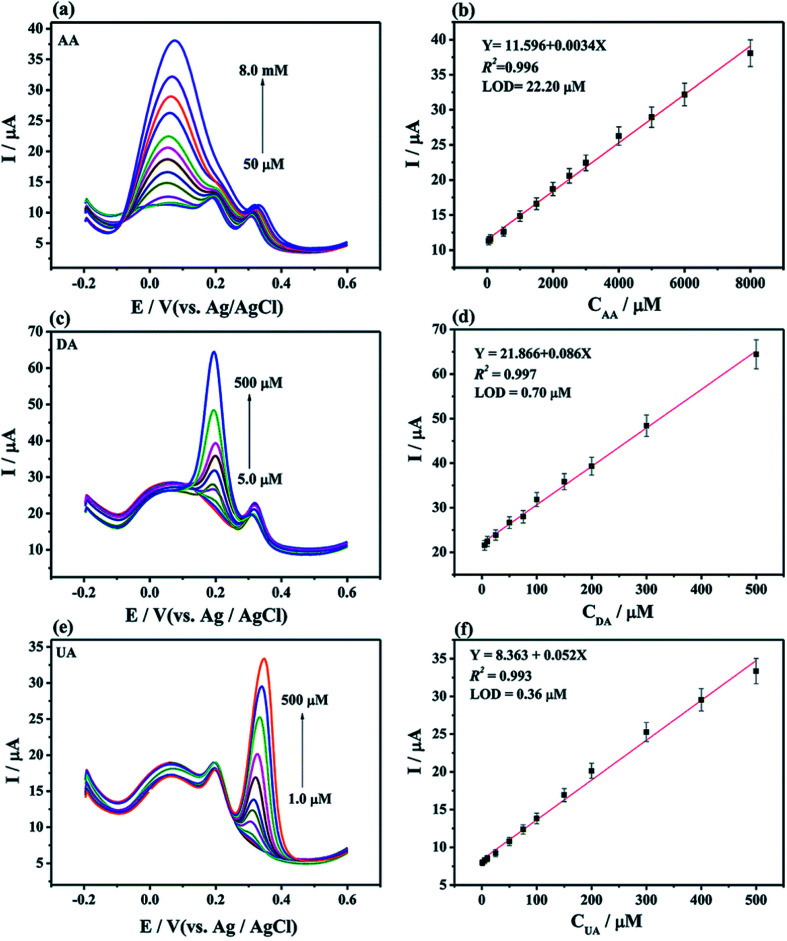
Fig. 21. (a) DPV curves of MoS2-PANI/rGO/GCE electrode and (b) the plot of peak currents as a function of AA concentration from 50 μM to 8.0 mM containing 75 μM DA and 75 μM UA. (c) DPV curves of MoS2-PANI/rGO/GCE and (d) the plot of peak currents as a function of DA concentration from 5.0 to 500 μM containing 1.0 mM AA and 75 μM UA. (e) DPV curves of MoS2-PANI/rGO/GCE and (f) the plot of peak currents as a function of UA concentration from 1.0 μM to 500 μM containing 1.0 mM AA and 75 μM DA. The solution used in the measurements was 0.1 M PBS (pH 7.0) containing 0.1 M KCl. [Reprinted with permission from ref. 458, S. Li, Y. Ma, Y. Liu, G. Xin, M. Wang, Z. Zhang and Z. Liu, Electrochemical sensor based on a three dimensional nanostructured MoS2 nanosphere-PANI/reduced graphene oxide composite for simultaneous detection of ascorbic acid, dopamine, and uric acid, RSC Adv., 2019, 9, 2997–3003. Copyright© Royal Society of Chemistry.].

Fig. 21