. 2019 Mar 18;9(16):8778–8881. doi: 10.1039/c8ra09577a

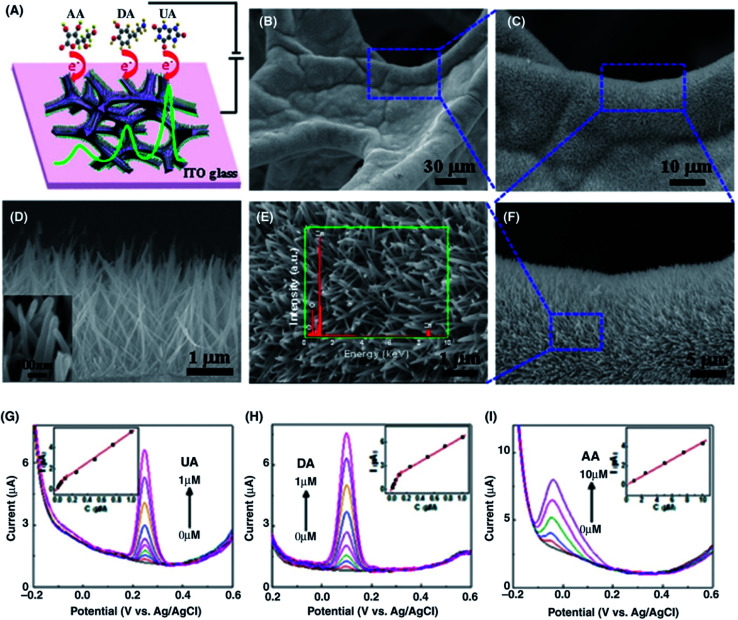
Fig. 22. (A) Schematic illustration of the ZnO NWAs/GF electrode for the simultaneous detection of UA, DA, and AA. (B–E) SEM images of the ZnO NWAs assembled on the 3D GF recorded at different magnifications. Inset shows the EDX of the ZnO NWAs. (F) SEM images showing the height of ZnO NWAs (∼2 μm). Inset shows the diameter of the ZnO NWAs (∼40 nm). (G–I) DPV curves for UA, DA, and AA measured using a ZnO NWA/GF electrode at different concentrations. The UA concentrations from the bottom are 0–1 μM. The DA concentrations from the bottom are 0–1 μM. The AA concentrations from the bottom are 0–10 μM. Insets show plots of the oxidation peak current as a function of concentration of each biomolecule, showing two slopes for UA and DA. [Reprinted with permission from ref. 493, H. Y. Yue, S. Huang, J. Chang, C. Heo, F. Yao, S. Adhikari, F. Gunes, L. C. Liu, T. H. Lee, E. S. Oh, B. Li, J. J. Zhang, T. Q. Huy, N. V. Luan and Y. H. Lee, ZnO Nanowire Arrays on 3D Hierarchical Graphene Foam: Biomarker Detection of Parkinson's Disease, ACS Nano, 2014, 8, 1639–1646. Copyright© American Chemical Society.].

Fig. 22