. 2019 Mar 18;9(16):8778–8881. doi: 10.1039/c8ra09577a

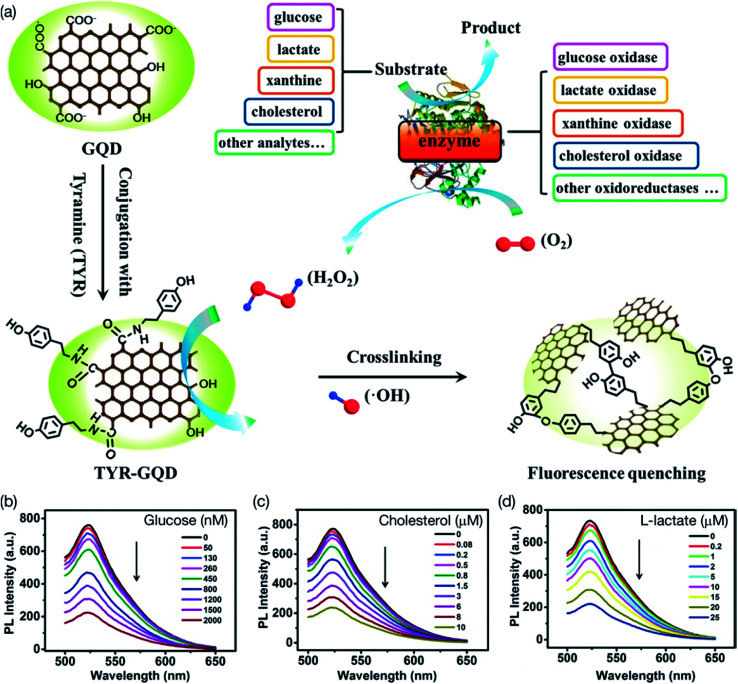
Fig. 32. (a) Schematic illustration of fluorescence detection scheme using tyramine-functionalized GQDs (TYR-GQDs). (b) Photoluminescence (PL) spectra of 0.1 mg mL−1 TYR-GQD in PBS (pH 7.0) containing 2.5 μM glucose oxidase and at different concentrations of glucose. (c) PL spectra of spectra of 0.1 mg mL−1 TYR-GQD in PBS (pH 7.0) containing 10 μM cholesterol oxidase and at different concentrations of cholesterol. (d) PL spectra of 0.1 mg mL−1 TYR-GQD in PBS (pH 7.0) containing 5 μM lactate oxidase and at different concentrations of l-lactate. [Reprinted with permission from ref. 670, N. Li, A. Than, X. Wang, S. Xu, L. Sun, H. Duan, C. Xu and P. Chen, Ultrasensitive Profiling of Metabolites Using Tyramine-Functionalized Graphene Quantum Dots, ACS Nano, 2016, 10, 3622–3629. Copyright© American Chemical Society.].

Fig. 32