. 2019 Mar 18;9(16):8778–8881. doi: 10.1039/c8ra09577a

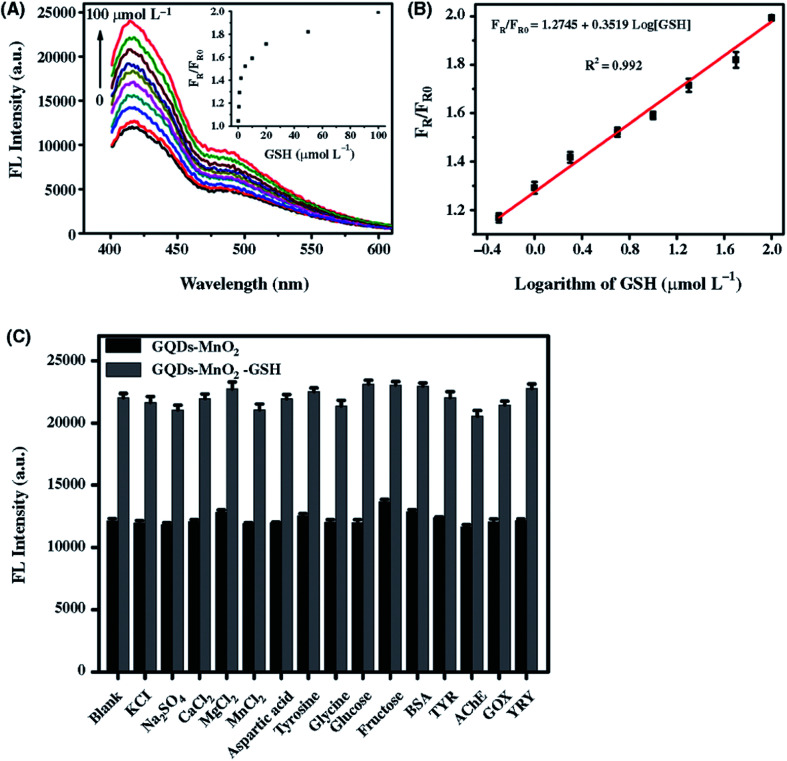
Fig. 39. (A) Fluorescence (FL) intensity of GQDs-MnO2 sensor with varying concentrations of glutathione (GSH) from 0 to 100 μmol L−1. Inset shows the FL intensity ratio trend varying concentrations of GSH. (B) Plot of FL intensity ratio (FR/FR0) against the logarithm of the concentration of GSH. (C) Selectivity of the GQD–MnO2-based fluorescence sensor toward glutathione pesticide. Fluorescence (FL) intensities of the GQD–MnO2 and GQD–MnO2–glutathione (GSH) sensors measured in the presence of 21 different interfering analytes. The concentration was 100 μg mL−1 for protein analytes, including bovine serum albumin (BSA), tyrosinase (TYR), glucose oxidase (GOx), acetyl cholinesterase (AChE), and trypsin (TRY), and 500 μmol L−1 for nonprotein analytes, including the inorganic salts KCl, Na2SO4, CaCl2, MgCl2, and MnCl2 as well as aspartic acid, tyrosine, glycine, glucose and fructose. The fluorescence intensities increased only after the addition of GSH to the GQD–MnO2 system and also showed recovery (blank column). [Reprinted with permission from ref. 737, X. Yan, Y. Song, C. Zhu, J. Song, D. Du, X. Su and Y. Lin, Graphene Quantum Dot–MnO2 Nanosheet Based Optical Sensing Platform: A Sensitive Fluorescence “Turn off–on” Nanosensor for Glutathione Detection and Intracellular Imaging, ACS Appl. Mater. Interfaces, 2016, 8, 21990–21996. Copyright© American Chemical Society.].

Fig. 39