. 2019 Mar 18;9(16):8778–8881. doi: 10.1039/c8ra09577a

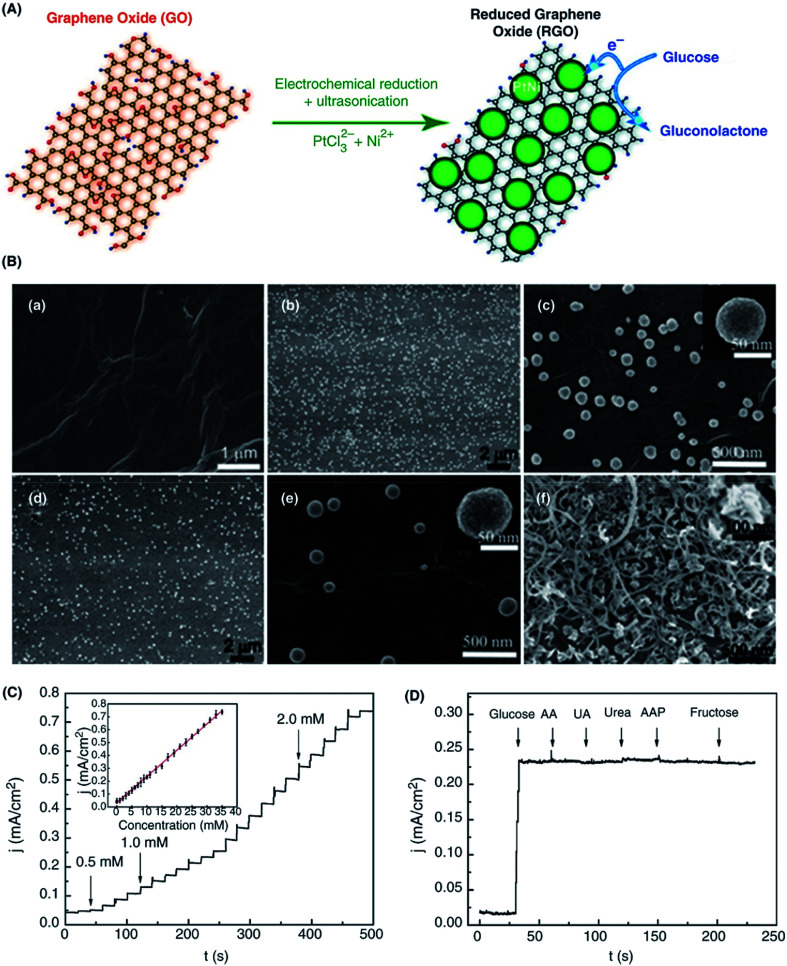
Fig. 9. (A) Schematic representation of the formation of PtNiNPs/rGO nanocomposites by electrochemical reduction method. (B) SEM images of the GO nanosheet, PtNiNPs/ERGO, PtNi NPs/CRGO nanocomposites and PtNiNPs/SWCNTs nanocomposites. (C) Amperometric response of PtNiNPs/ERGO/GCE after adding 0.5, 1.0, and 2.0 mM glucose and the calibration curve (inset). (D) Influence of interfering bioanalytes including 0.5 mM ascorbic acid (AA), 0.1 mM uric acid (UA), 0.1 mM urea, 0.5 mM AAP, and 0.5 mM fructose to 5.0 mM glucose at the PtNiNPs/ERGO/GCE. Here, electrochemically and chemically reduced GO are ERGO and CRGO, respectively. [Reprinted with permission from ref. 229, H. Gao, F. Xiao, C. B. Ching and H. Duan, One-Step Electrochemical Synthesis of PtNi Nanoparticle-Graphene Nanocomposites for Nonenzymatic Amperometric Glucose Detection, ACS Appl. Mater. Interfaces, 2011, 3, 3049–3057. Copyright© American Chemical Society.].

Fig. 9