. 2019 Mar 19;9(16):9014–9021. doi: 10.1039/c9ra00896a

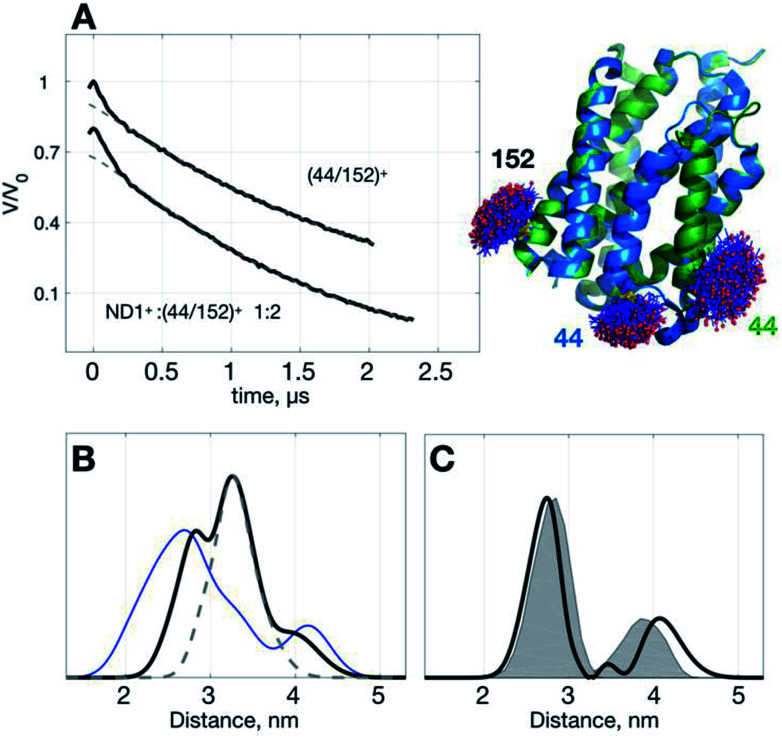
Fig. 3. Use of ND1+ to improve TIKR distance resolution for YetJ-44/152. (A) DEER time-domain traces (black) measured at pH 7 are shown on the left. Cartoon models displaying the two crystal structures of YetJ (PDB: 4PGS and 4PGR, colored in green and blue, respectively) found to be in equilibrium at pH 7. (B) Normalized TIKR distance distributions of (44/152)+ (blue) and ND1+ : (44/152)+ 1 : 2 (black), in which the latter exhibits a clear reduction in the distribution width compared to the former. The result of ND1+ (gray dashed; taken from Fig. 1) is shown to indicate that the contribution of ND1+ can be conveniently removed from the TIKR result shown in black. (C) Distance distribution (black) after the subtraction of ND1+ component from the distance distribution of the ND1+ : (44/152)+ 1 : 2 sample. It reveals two major peaks at 2.74 nm and 4.07 nm, in a reasonable agreement with the MtsslWizard predictions, 2.79 nm and 3.87 nm (gray shaded areas).

Fig. 3