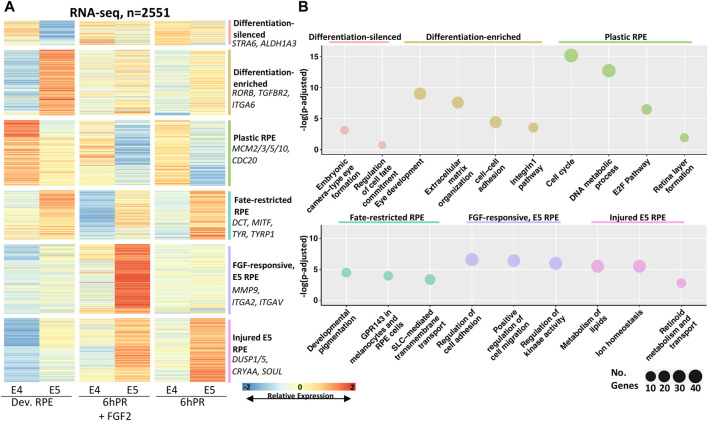
FIGURE 2.
Clustering of differentially expressed genes reveals expression programs associated with RPE commitment and reprogramming. (A) Affinity propagation clustering was performed on all genes that are differentially expressed across the E4 to E5 window by the criteria |LFC| ≥ 1 and adj. p-value ≤ 0.05 (n = 2551), resulting in six clusters. Key genes are summarized on the right of heatmap. The heatmap intensity displays row-normalized gene counts. (B) Bubble charts display select gene ontology terms associated with each cluster. Adj. p-value is plotted on y-axis and the bubble size is proportional to number of terms identified in the analysis.

