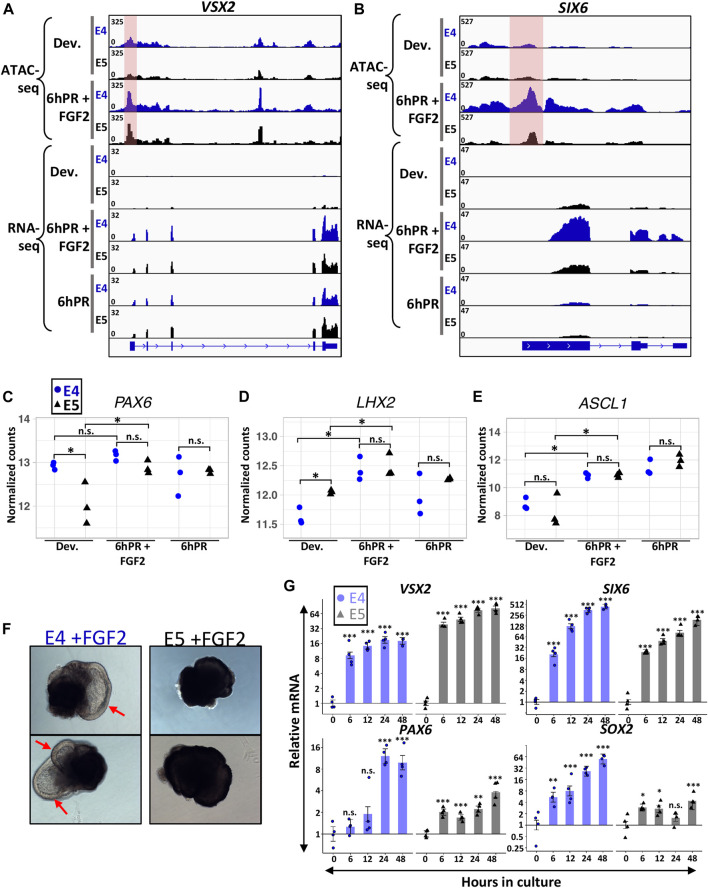
FIGURE 3.
Neural retina identity genes are active 6hPR + FGF2 at E4 and E5. Genome browser views display the VSX2 (A) and SIX6 (B) loci, with the normalized counts for ATAC-seq and RNA-seq assays summarized in the coverage tracks above. The highlighted pink area represents changes in promoter-region accessibility. Normalized gene expression counts are displayed for neural retina-associated genes PAX6 (C) LHX2 (D) and ASCL1 (E). The y-axes are log-transformed. Asterisk (*) denotes an Adj. p-value ≤ 0.05. n.s., not significant. (F) Two representative RPE explants are shown after 48 h in culture in the presence of FGF2 at E4 (left) or E5 (right). Red arrows point to RPE-derived neural retina from E4 explants. (G) Gene expression was measured via RT-qPCR using explants cultured in the presence of FGF2 at E4 or E5 and collected at the specified time points. Bar chart displays the average expression, and the error bars represent standard error of the treatment mean based on ANOVA. Each dataset is normalized to basal levels observed at time 0; y-axes are log2-transformed. qPCR significance: n.s. denotes not significant, * denotes p-value < 0.05, ** denotes p-value < 0.01, *** denotes p-value < 0.001.

