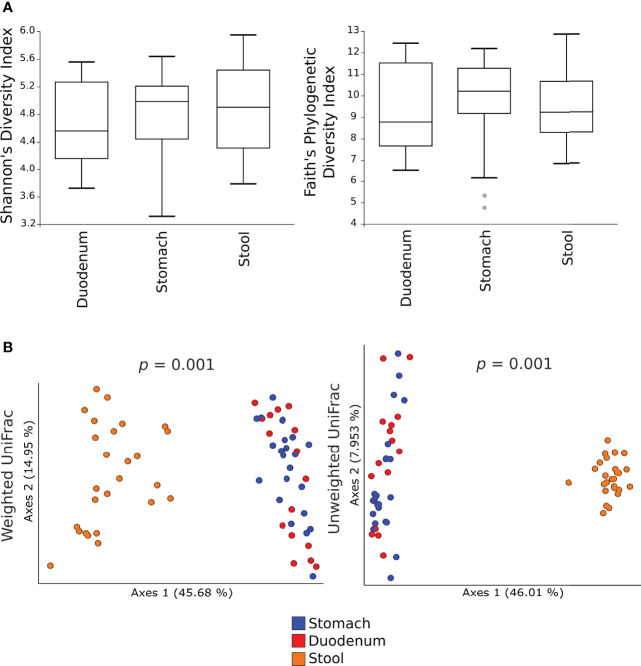
Figure 1.
Alpha- and beta- diversity of the microbial communities in gastric, duodenal, and faecal samples. Shannon’s diversity and Faith’s phylogenetic diversity indexes were used as measure of alpha-diversity within groups (A). Samples were rarefied to the smallest observed number of reads (1257 for gastric biopsies, 931 for duodenal biopsies and 2935 for faecal samples). The circles out of the range represent the outliers; Principal coordinate analysis (PCoA) plots of weighted and unweighted UniFrac distances are represented (B). Each dot represents the bacterial community composition of one individual at each anatomical site. Groups were compared using Adonis for beta diversity.

