
FIGURE 3.
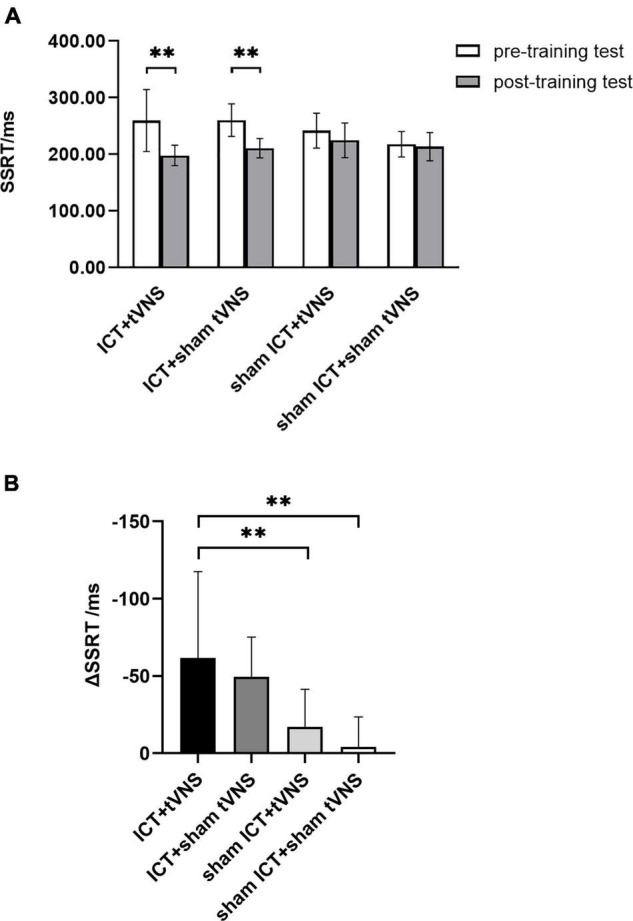
(A) The performance of SST tests: SSRT of the SST between pre- and post-training tests. (B) The performance of SST tests: The decrement of the SSRT for each group. **P < 0.01, Error bars represent the standard error of the mean.
Official websites use .gov
A
.gov website belongs to an official
government organization in the United States.
Secure .gov websites use HTTPS
A lock (
) or https:// means you've safely
connected to the .gov website. Share sensitive
information only on official, secure websites.
(A) The performance of SST tests: SSRT of the SST between pre- and post-training tests. (B) The performance of SST tests: The decrement of the SSRT for each group. **P < 0.01, Error bars represent the standard error of the mean.