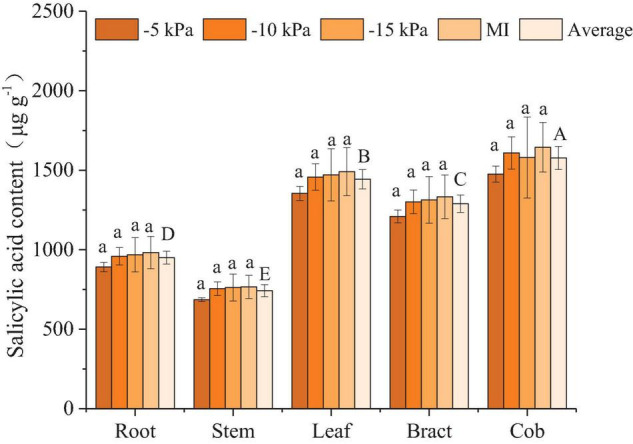
FIGURE 5.

Salicylic acid content in different organs of maize under different treatments. Values represent mean ± SD. The least significant difference method was used to test differences among treatments or organs at the P < 0.05 level. Different lowercase letters indicate significant differences among treatments within the same organ, and different capital letters on the average value of all treatments in each organ indicate significant differences among organs.
