. 2019 Mar 29;9(18):10030–10033. doi: 10.1039/c9ra00849g

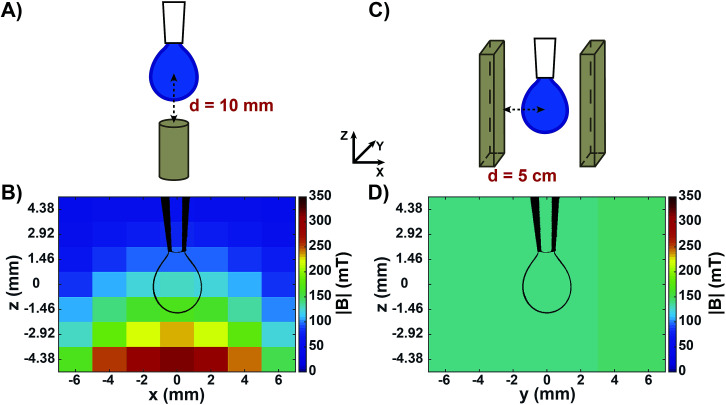
Fig. 1. Experimental setups and measured maps of the magnetic field around a pendant drop. (A) Sketch of a pendant drop in a non-homogeneous magnetic field generated by a small permanent magnet placed below the drop. The distance between the magnet surface and the centre of the drop was d = 10 mm. (B) Map of the measured magnetic field norm (|B|) around the drop in (A). (C) Sketch of a pendant drop in a homogeneous magnetic field generated by two permanent magnets placed parallel to each other, each at a distance d = 5 cm from the drop centre. (D) Map of the measured magnetic field norm (|B|) around the drop in (C). The indicated x, y, z coordinates refer to all (A–D) panels. Drawings of the drop contours (to scale) are shown in (B) and (D) for helping visualizing the drop position in the magnetic field.

Fig. 1