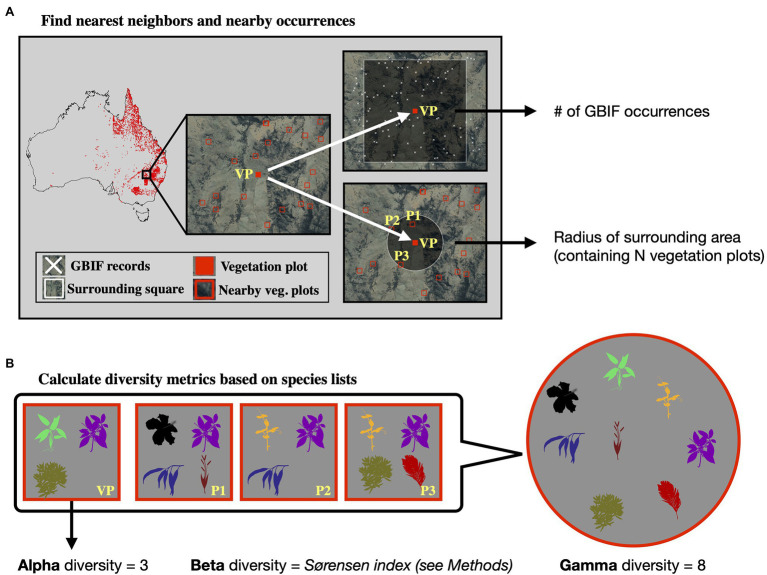
Figure 2.
Calculation of diversity measures from vegetation plot data. For a given vegetation plot (VP, solid red square, panel A) we identified the N nearest neighboring vegetation plots in space (N = 3 in this example, represented by plots P1–P3). We exported the radius of the smallest circle encompassing all N neighbors as a feature for model training. Additionally, we exported the number of GBIF occurrences within a square of 10 × 10 km size around the given vegetation plot, as a measure of sampling effort in the general area. Having identified the nearest neighbors (P1–P3), we compared the species lists of these vegetation plots with the focal vegetation plot (VP, panel B). Alpha diversity represents the number of species found in the focal vegetation plot (VP), while gamma diversity represents the total diversity consisting of all species identified among the focal and neighboring vegetation plots. Beta diversity was calculated using the multiple-site Sørensen dissimilarity index (see section “Materials and Methods”), based on the differences in species composition found among the selected vegetation plots.

