
Figure 18.
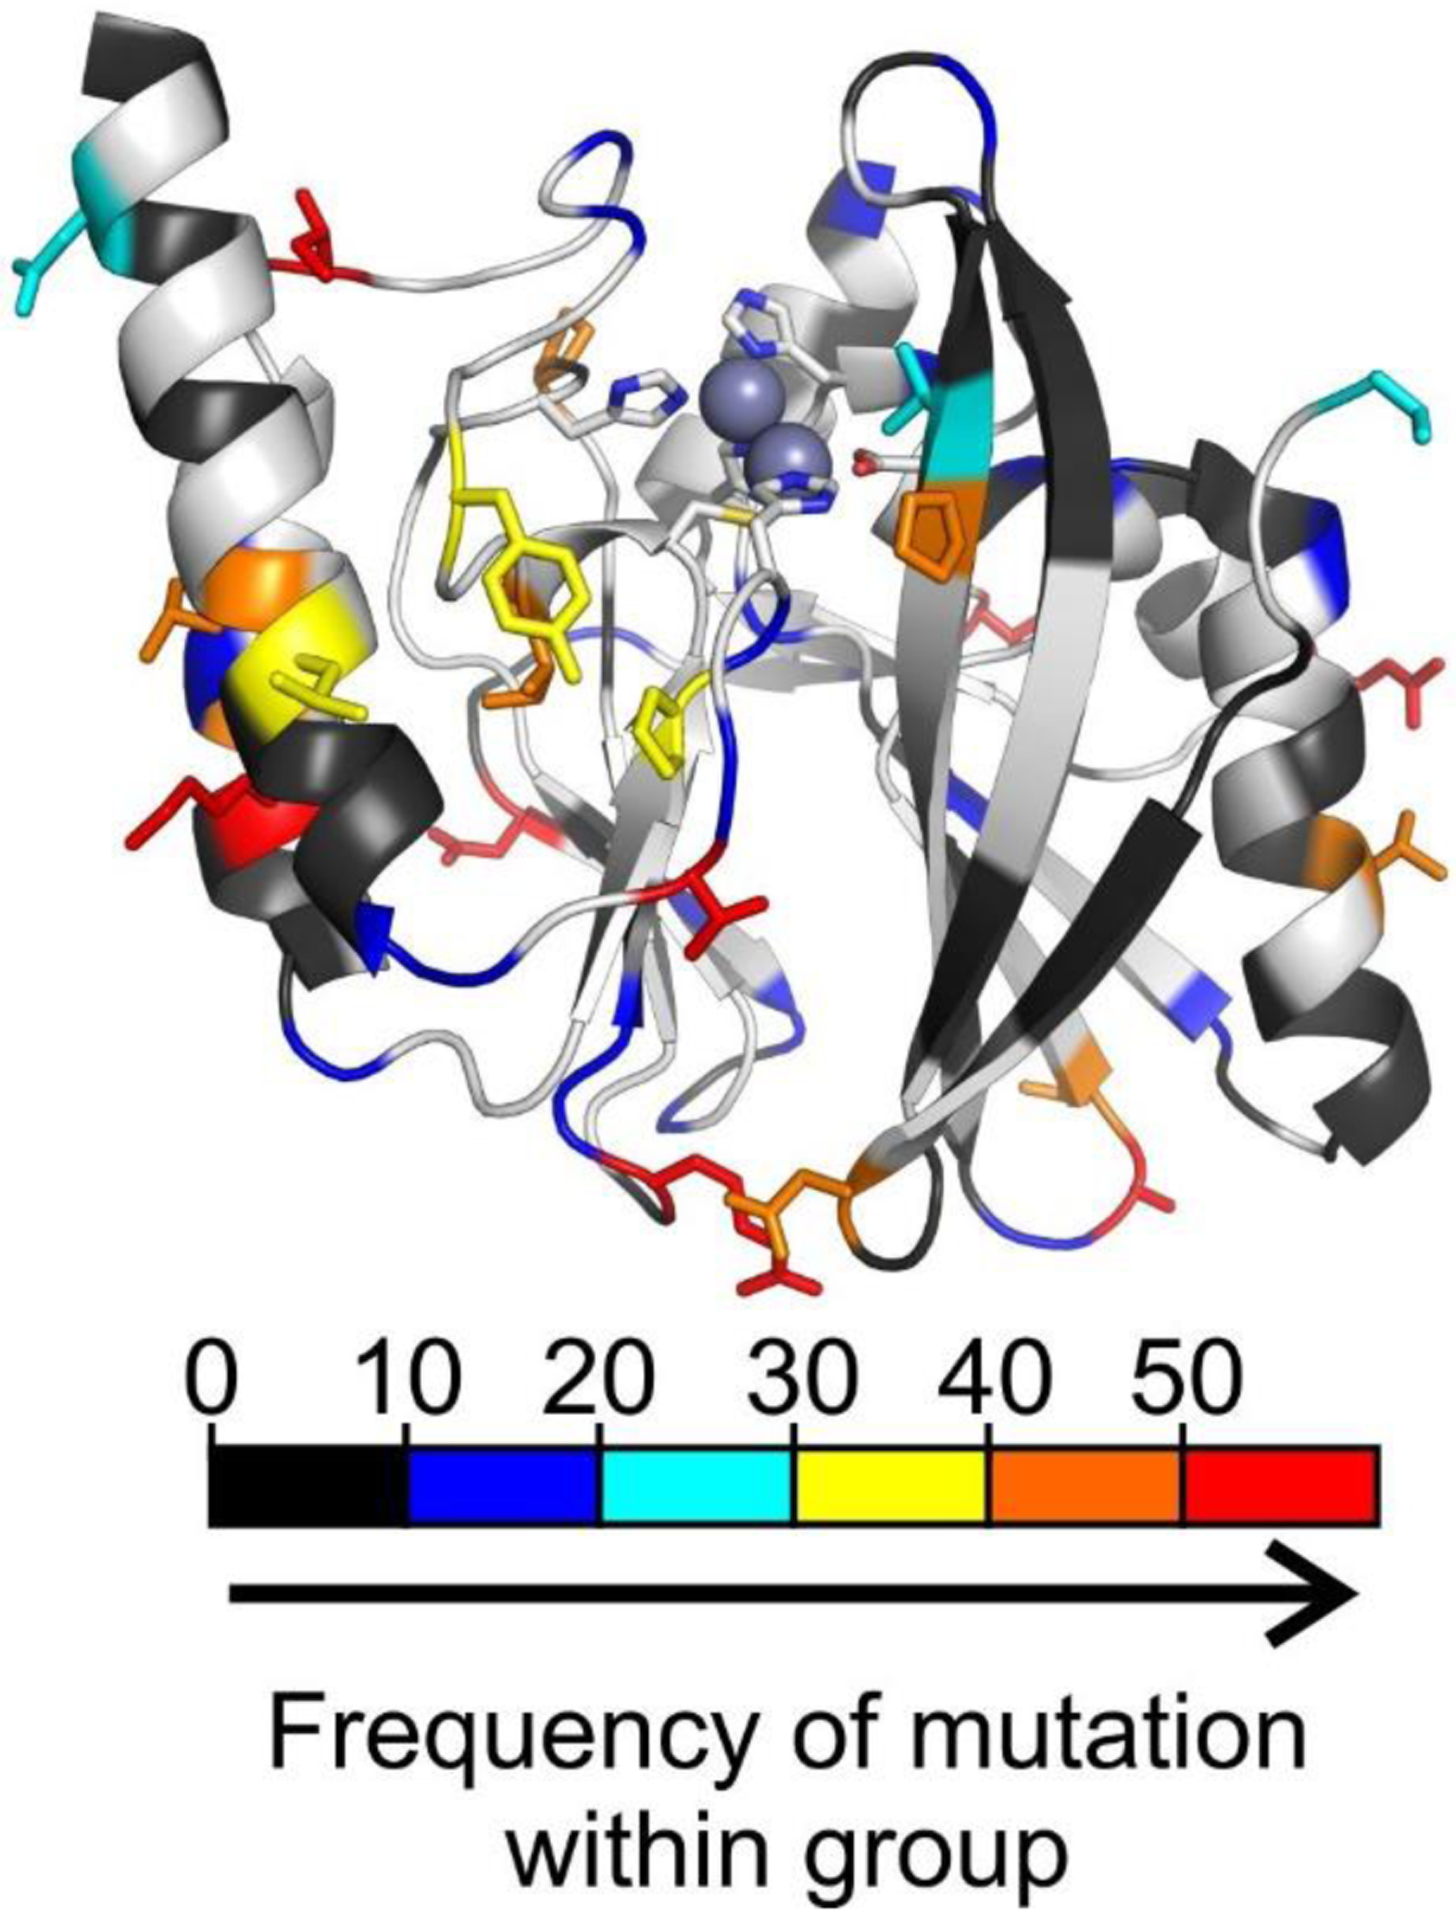
Structure of IMP-1 (PDB 4C1G) highlighting the positions presenting sequence variation within the IMP family. The positions are colored (from black to red) in the cartoon representation according to an increasing absolute frequency of mutation within all IMP enzymes with respect to IMP-1. The side chains of positions with a frequency of substitution in the top 4 categories are shown as sticks.