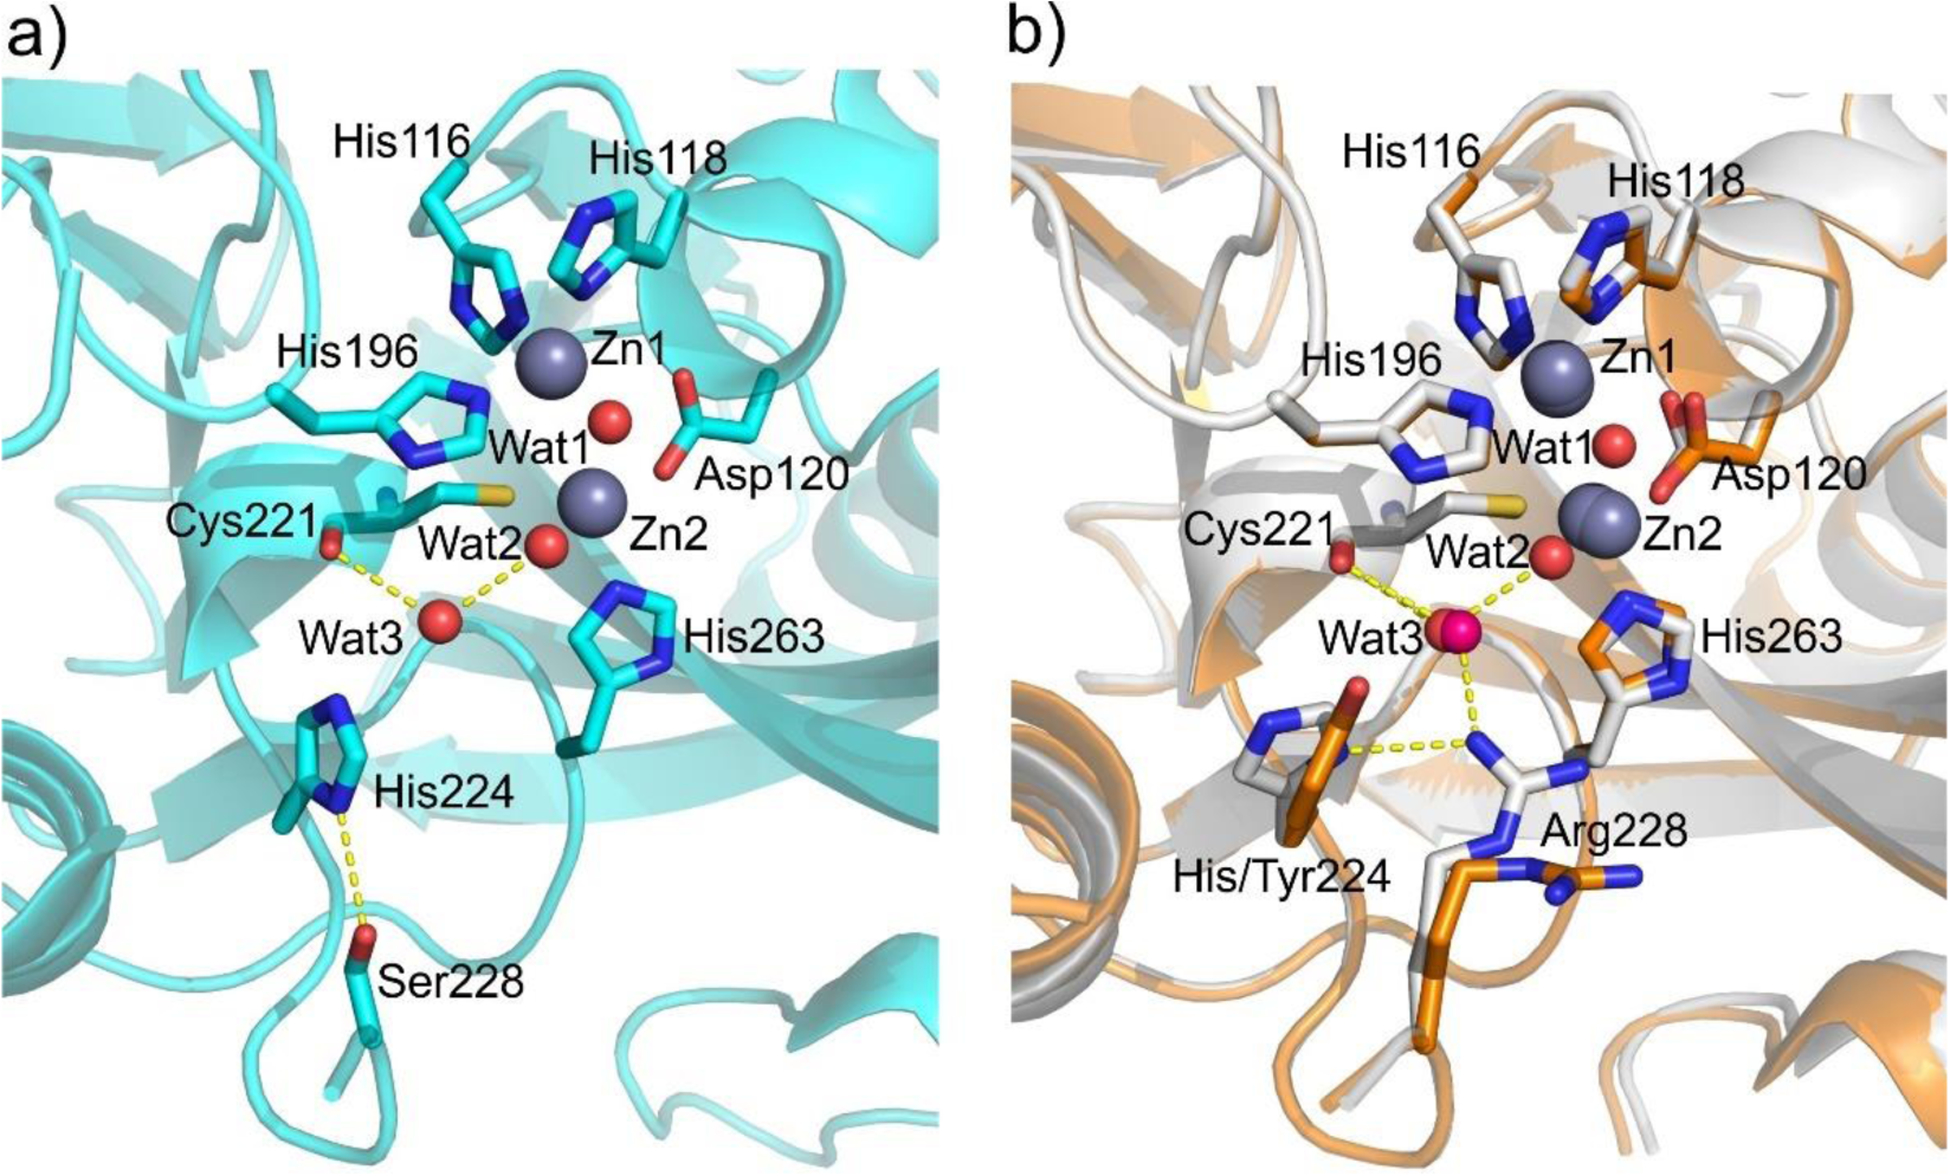
Figure 25.

Comparison of VIM active sites.259 a) Active site of VIM-1, showing positions of His224 and Ser228 and location of Cys221-bound water Wat3. Hydrogen bonding interactions are shown as dashed lines (PDB 5N5G). b) Active site superpositions of VIM-2 (PDB 4BZ3, orange) and VIM-4 (PDB 2WHG, white) showing variations at positions 224 and 228.
