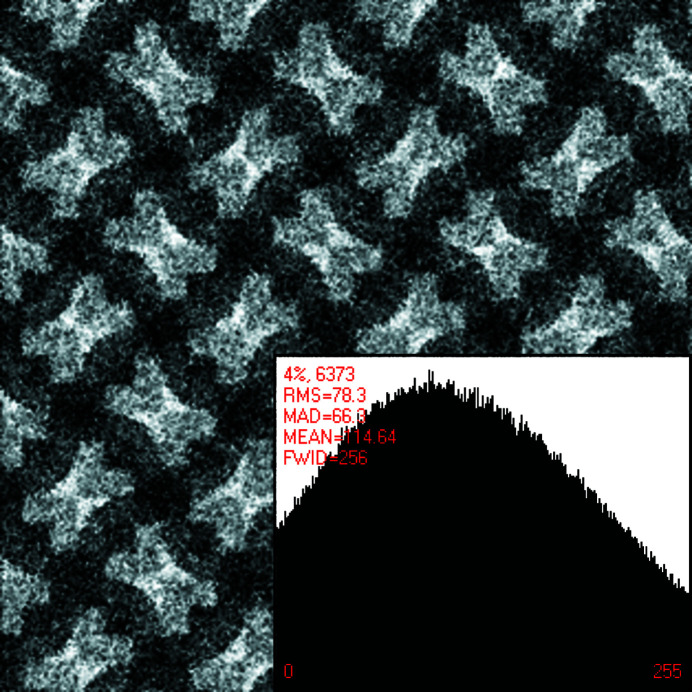
Figure 6.
Section of the underlying crystal pattern of Fig. 1 ▸ with a large amount of approximately Gaussian distributed noise added. The histogram of the whole pattern is provided as inset. Note that all of the five narrow peaks in the histogram in Fig. 1 ▸ are now ‘overwhelmed’ by the added noise, resulting in a single peak that may be characterized as approximately Gaussian distribution but with fat tails.A9

