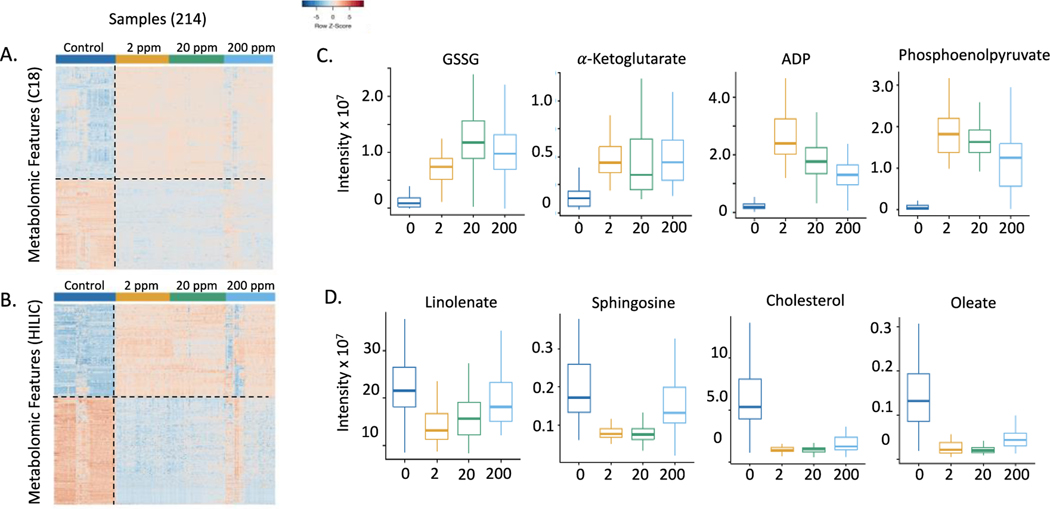
Figure 1.
One-way hierarchical clustering analysis (HCA) of discriminatory metabolites selected by PLS-DA analysis of control and BD-exposed mice. A. For the C18/ESI- method, there were 771 features that increased and 599 features that decreased in the BD-exposed mice relative to the controls. B. For the HILIC/ESI+ method, there were 835 features that increased and 972 features that decreased in BD-exposed mice relative to the controls. C. Metabolic changes representative of the patterns seen for differentially expressed features in control mice and mice exposed to 2 ppm, 20 ppm, and 200 ppm butadiene. Metabolic effects were seen at the lowest level of butadiene exposure. In panels C and D, metabolites were significantly different in exposure groups vs. controls with p<0.001

