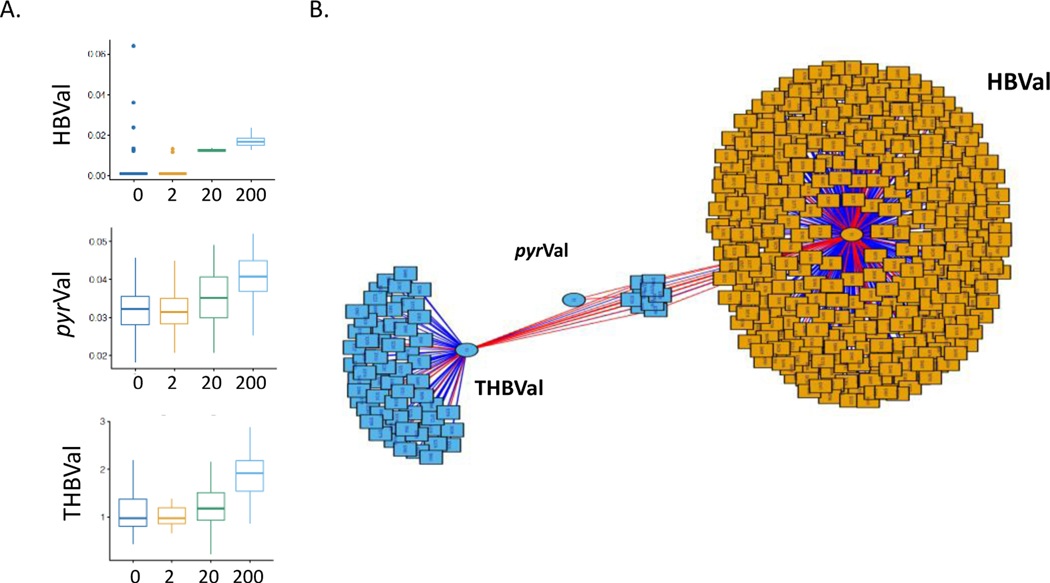
Figure 5.
A. The protein adducts formed from butadiene metabolites were measured in blood. B. xMWAS was used to look for correlations between the butadiene protein adducts and the metabolomic features with a minimum correlation of 0.4. Red lines represent positive correlations and blue lines represent negative correlations.

