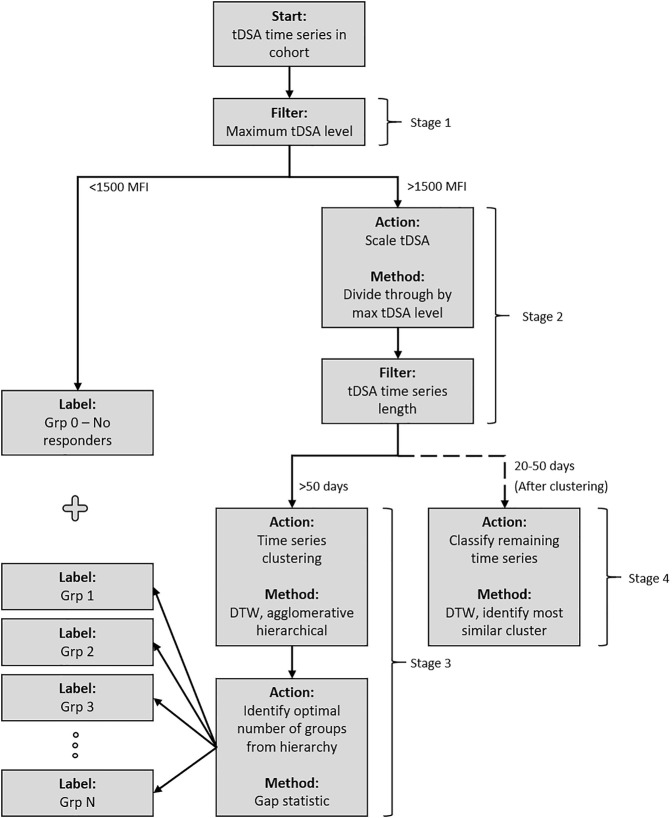
FIGURE 2.
Post-transplant DSA dynamics clustering methodology. The cohort is passed through the system and sorted into groups based on the similarity of post-transplant DSA dynamics. Stage 1 separates DSA into a pre-designated “no response” group if their maximum post-transplant tDSA titre level is less than 1500 MFI. Stage 2 scales the remaining DSA based on maximum post-transplant tDSA titre level before an additional filter is applied, separating the DSA based on time series length. All data which have 50 days are passed to Stage 3 and subsequently clustered using DTW distance measure under an agglomerative hierarchical structure. The optimal numbers of groups within the structure are identified using the gap statistic. Stage 4 classifies the remaining DSA, which have 20–50 days of data, into the groups identified in Stage 3.

