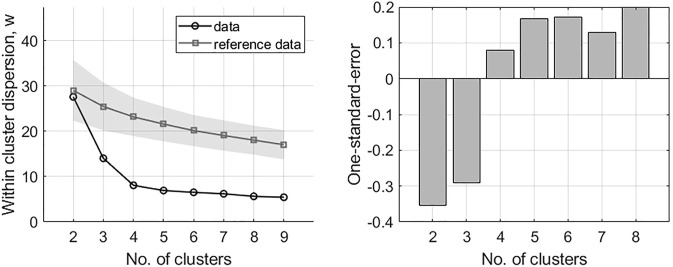
FIGURE 3.
Results of the gap analysis for DSA time series. Left: within-cluster dispersion, the standard deviation is indicated for reference data via the shaded region. Right: one-standard-error measurements. The optimal number of clusters is indicated by the lowest k on the left in combination with positive one-standard-error measurement on the right; in this case, k = 4.

