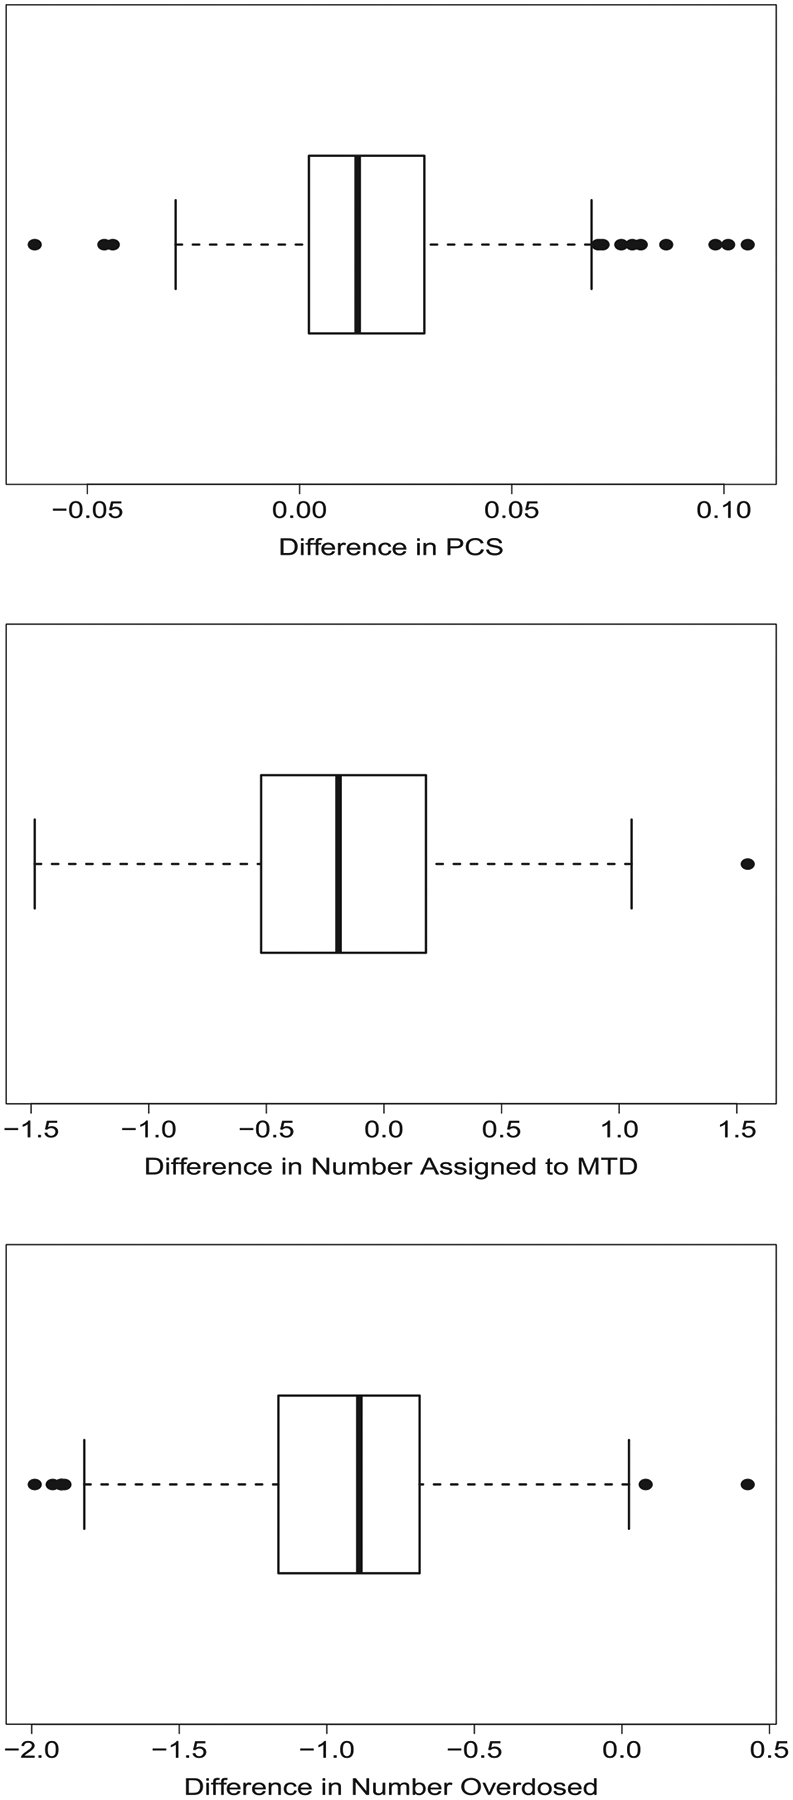
FIGURE 1.

Boxplots of differences in operating characteristics of a CRM design with 30 participants produced by a traditional simulation study of 5000 simulations and the proposed method over 1000 different consistent skeletons. The vector of true DLT probabilities is α = (0.01, 0.03, 0.11, 0.25, 0.41, 0.57). The upper plot presents the difference in the probability of correct selection (PCS) of the maximum tolerated dose (MTD); the middle plot presents the difference in the average number of participants assigned to the MTD; the lower plot presents the difference in the average number of participants assigned to doses above the MTD. Difference is computed as result from proposed method minus result from traditional simulations. CRM, continual reassessment method
