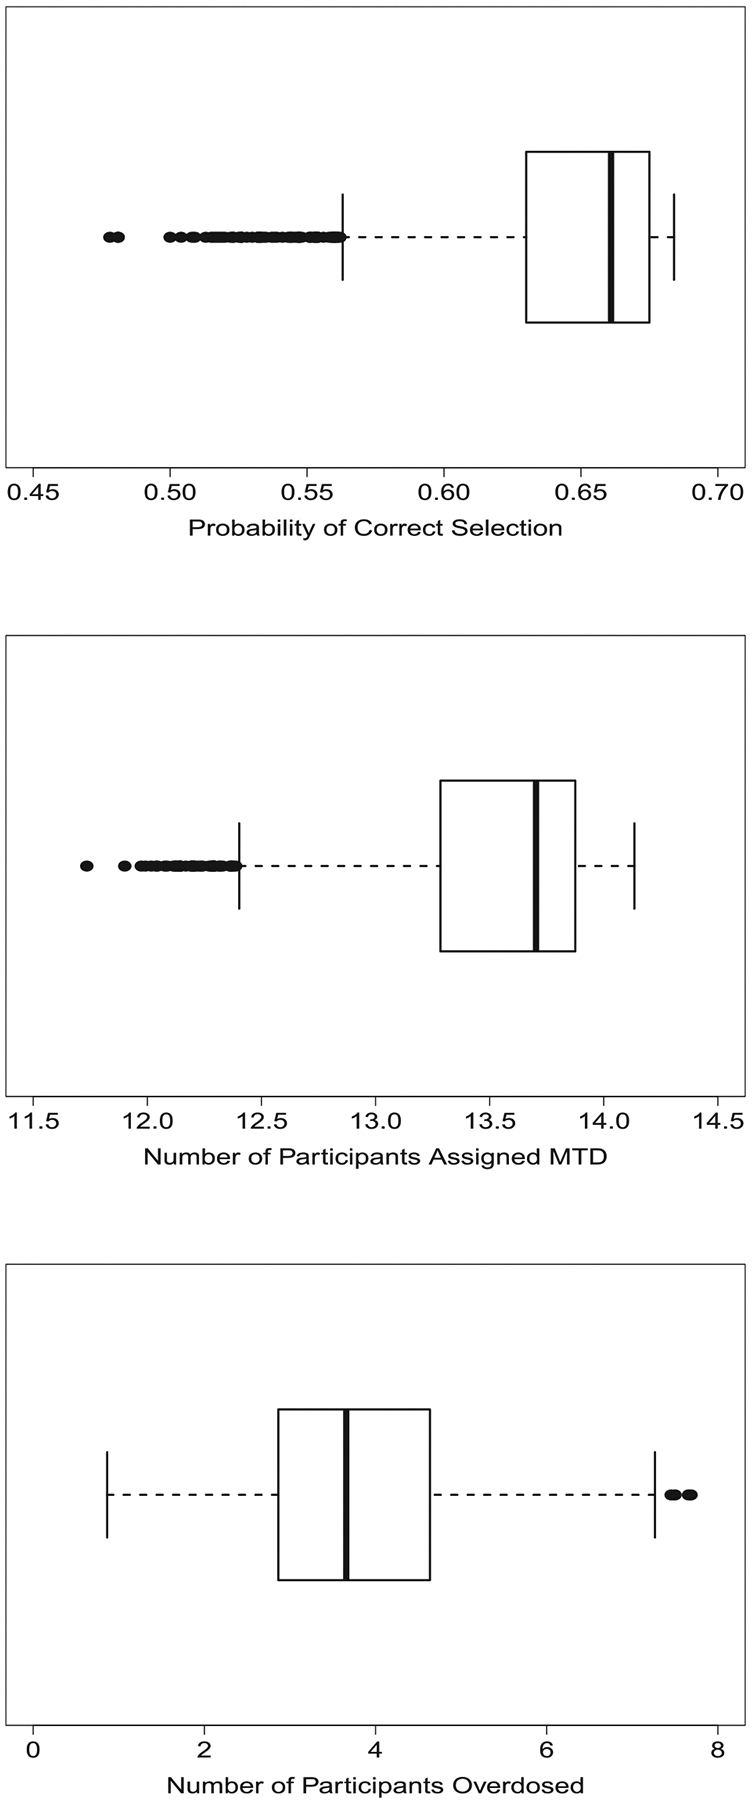
FIGURE 2.

Boxplots of operating characteristics of a CRM design with 30 participants produced by the proposed method over 1000 different consistent vectors of true DLT probabilities using a skeleton o π = (0.03, 0.11, 0.25, 0.42, 0.58, 0.71). The upper plot presents the probability of correct selection (PCS) of the maximum tolerated dose (MTD); the middle plot presents average number of participants assigned to the MTD; the lower plot presents the average number of participants assigned to doses above the MTD. CRM, continual reassessment method
