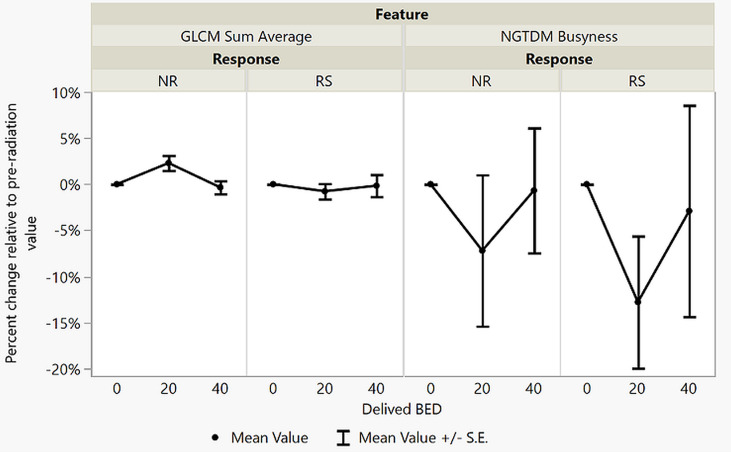
Figure 3.
The values of the top two performing texture features in terms of internal validation AUC from the BED20 model. Y-axes are the percent change relative to the pre-RT (0 Gy) values graphed at each point of 20 Gy and 40 Gy. The plots display the mean percent change in each feature value, the points, the ranges represent the range of the standard error from the means.

