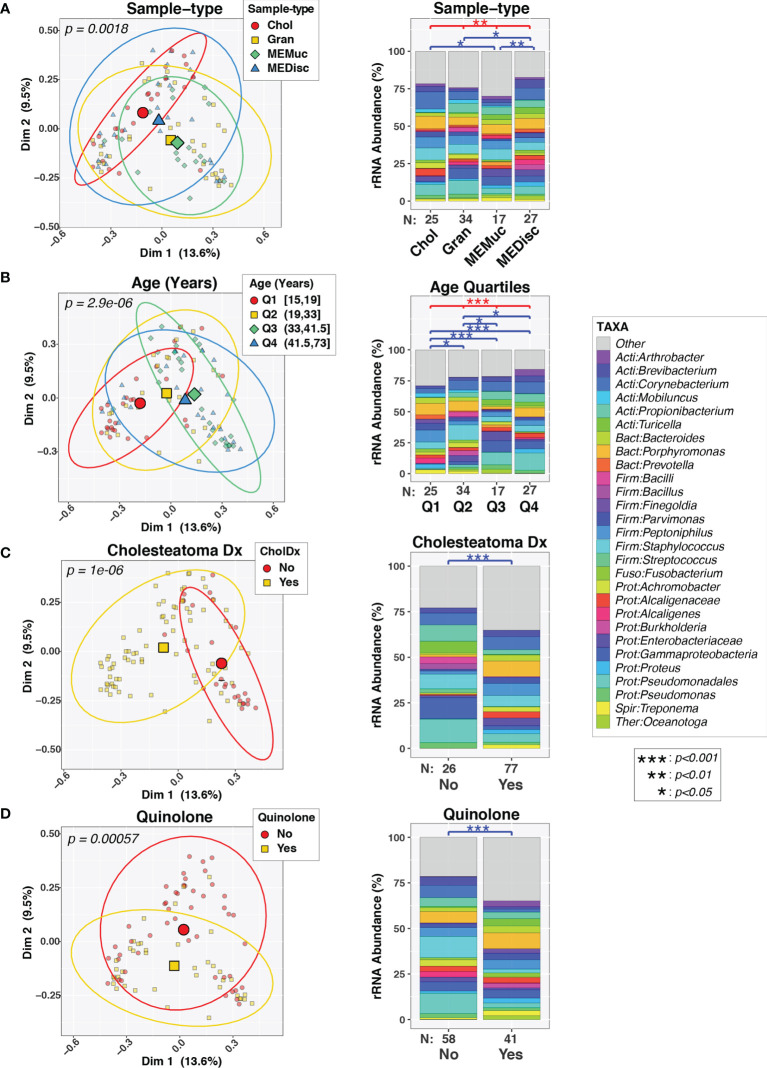
Figure 1.
Variability in composition of middle ear microbiota. Pairs of plots show beta-diversity across sample-types (A), age quartiles (B), cholesteatoma diagnosis (C), or quinolone use (D). The left column displays principal coordinates analysis (PCoA) plots of the first two PC axes, color- and symbol-coded by the indicated variables. Smaller symbols designate individual subjects while larger symbols represent group means along both PC axes. Ellipses designate 90% confidence level for a multivariate t-distribution. The right column displays barcharts summarizing the mean relative abundances of predominant taxa (>2%RA) in each group; rarer taxa are grouped into the “Other” category. Results of PERMANOVA tests are indicated above barcharts. Red lines/symbols indicate p-values across all 4 groups. Blue lines/symbols indicate FDR-corrected p-values for pairwise comparisons.

