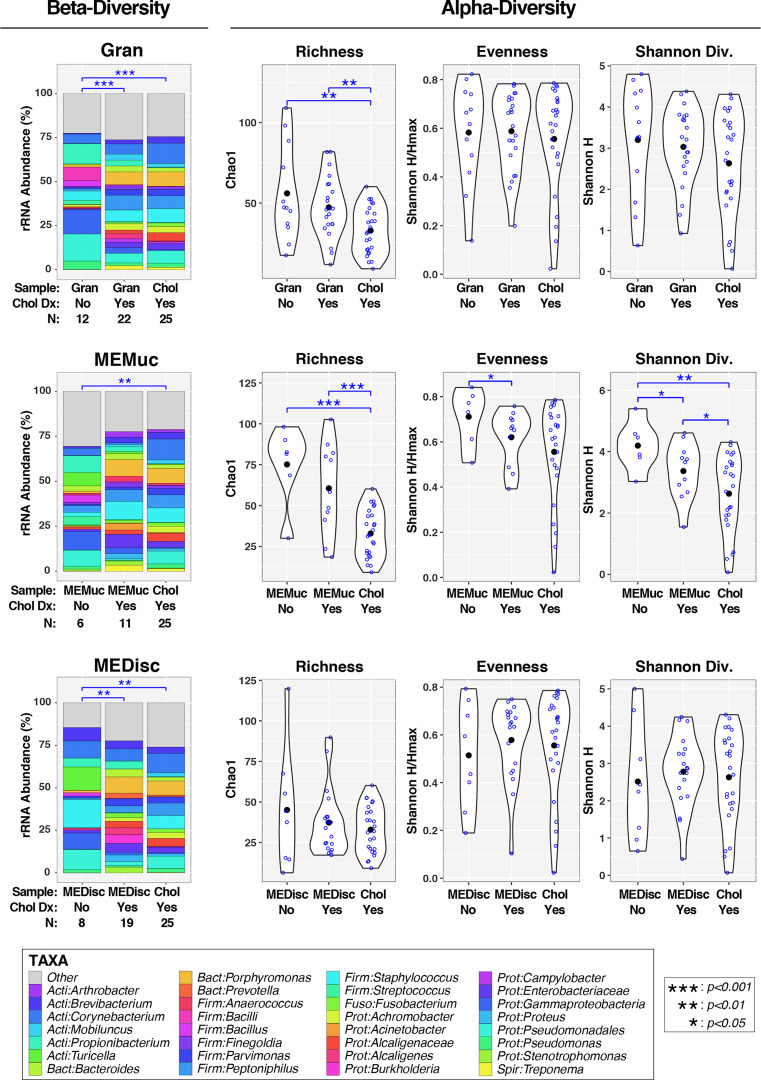
Figure 3.
Association of cholesteatoma diagnosis with middle ear microbiota. Each panel compares microbiota for either Gran, MEMuc, or MEDisc samples between patients without and with cholesteatoma diagnosis; for comparison, each panel includes Chol samples from patients with cholesteatoma. The left column (under the heading “Beta-Diversity”) displays barcharts summarizing the mean relative abundances of predominant taxa (>2%RA) in each comparison group; rarer taxa are grouped into the “Other” category. Results of PERMANOVA tests (adjusted for age and quinolone use) are indicated above barcharts. Blue lines/symbols indicate FDR-corrected p-values for pairwise comparisons. The right columns (under the heading “Alpha-Diversity”) display violin plots for each comparison group. Open blue circles indicate individual samples while filled black circles designate group means. Results of linear mixed-effects tests (adjusted for age and quinolone use) are indicated above violin plots. Blue lines/symbols indicate p-values for pairwise comparisons with false discovery rate correction.

