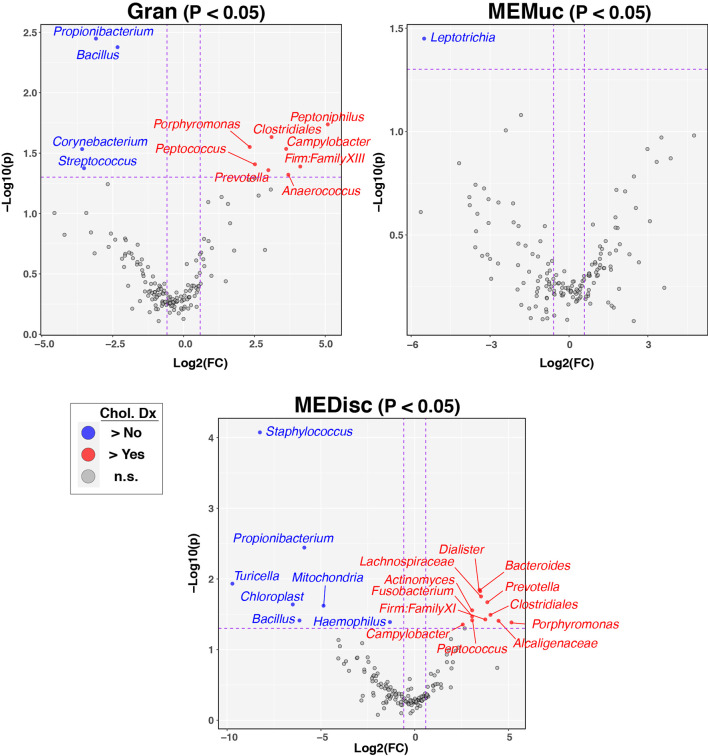
Figure 4.
Individual taxa differing between patients with and without cholesteatoma diagnosis. Between-group differences in the relative abundance of individual bacterial taxa were identified using the ANOVA-like differential expression (ALDEx2) test, which considers the compositional nature of microbiota datasets. The three panels show results stratified by sample-type (Gran, MEMuc, or MEDisc). Vertical dashed lines indicate fold-change cutoffs≥1.5. Horizontal dashed lines show p-value cutoffs for comparisons (nominal p ≤ 0.05). Blue circles in the upper left quadrants denote taxa enriched in patients without cholesteatoma diagnosis while red circles in the upper right quadrants denote taxa enriched in patients with cholesteatoma diagnosis.

