. 2019 Apr 10;9(20):11230–11238. doi: 10.1039/c9ra00818g

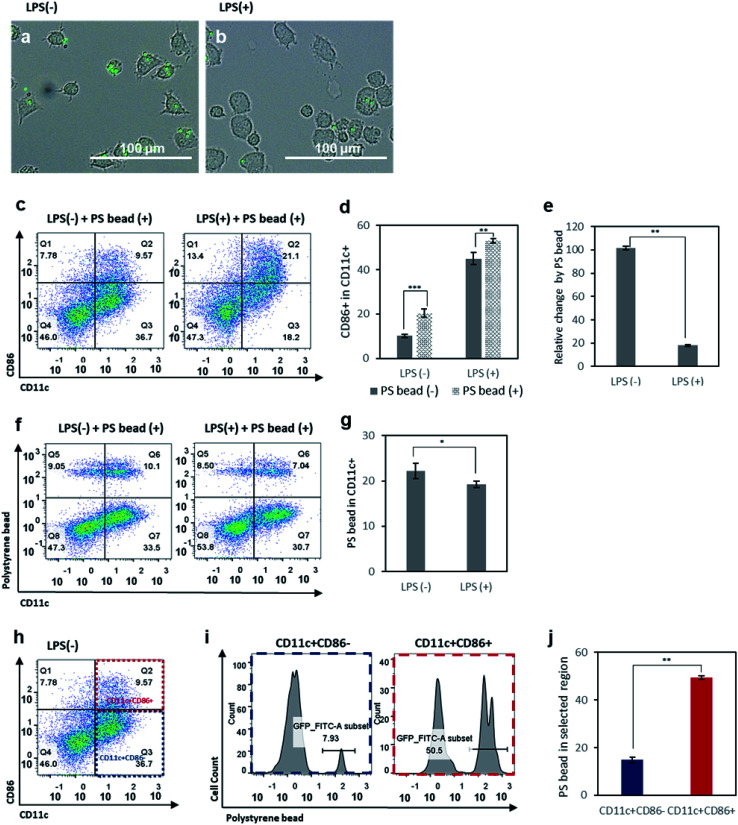
Fig. 2. Optical microscopy images of (a) control BMDCs and (b) LPS-treated BMDCs incubated with FITC-conjugated polystyrene (PS) beads (1.80–2.20 μm). (c) Flow cytometry plots of control BMDCs and LPS-treated BMDCs after incubation with fluorescent PS beads. (d) Activation levels of control BMDCs and LPS-treated BMDCs with or without incubation with PS beads. (e) Relative change in activation levels among control BMDCs and LPS-treated BMDCs, induced by incubation with PS beads. (f) Flow cytometry plots of control BMDCs and LPS-treated BMDCs after incubation with PS beads, used to analyze the cellular uptake of PS beads by CD11c+ DCs using the fluorescence intensity of FITC-conjugated PS beads. (g) Quantitative analysis of cellular uptake levels of PS beads by control BMDCs and LPS-treated BMDCs. (h) Flow cytometry plot of control BMDCs, used to analyze cellular uptake levels of PS beads in the CD11c+CD86+ and CD11c+CD86 populations. (i) Flow cytometry histograms of PS bead uptake in the CD11c+CD86+ and CD11c+CD86 populations. (j) Quantitative analysis of PS bead uptake levels in the CD11c+CD86+ and CD11c+CD86 populations. Data are presented as mean values ± SD. *P < 0.05, **P < 0.01, ***P < 0.001.

Fig. 2