. 2019 Apr 10;9(20):11230–11238. doi: 10.1039/c9ra00818g

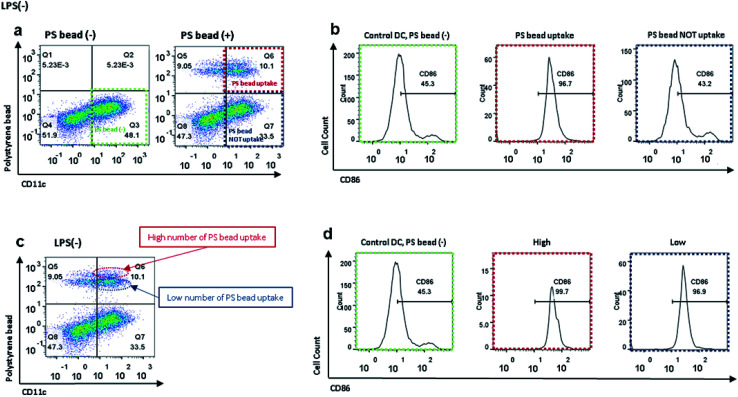
Fig. 3. (a) Flow cytometry plots of control BMDCs and BMDCs after incubation with PS beads to analyze CD86 level affected by cellular uptake of PS beads; green: control BMDCs without incubation with PS beads, red: control BMDCs after incubation with PS beads and PS bead uptake, blue: control BMDCs after incubation with PS beads but without PS bead uptake. (b) Flow cytometry histograms represent CD86 levels in control BMDCs and BMDCs with and without PS bead internalization. (c) Flow cytometry plot of control BMDCs after incubation with PS beads to analyze CD86 level affected by number of PS beads that were internalized by CD11c+ cells; red: control BMDCs with high number of PS bead uptake, green: control BMDCs with low number of PS bead uptake. (d) Flow cytometry histograms represent CD86 levels in control BMDCs and BMDCs after incubation with PS beads, with high and low number of PS bead uptake.

Fig. 3